


Restaurant Profit And Loss Template: A Simple Monthly P&L
Most restaurant owners know whether last month felt busy or slow. Fewer can tell you exactly where the money went. A restaurant profit and loss template gives you that clarity, a single document that lays out your revenue, costs, and expenses so you can spot problems before they drain your bank account.
The math matters more than most operators realize. A line item like third-party delivery commissions might look small on a single order, but across a full month, those 30% fees can quietly eat tens of thousands of dollars in profit. That's exactly why we built The Foody Gram, to help restaurants eliminate commission fees on online orders and keep more of what they earn. But cutting costs only works if you're actually tracking them, and a P&L statement is where that tracking lives.
In this guide, you'll get a free, downloadable monthly P&L template you can start using right away in Excel, Google Sheets, or PDF. We'll also walk you through each section of the statement, explain what the numbers mean, and show you how to use your P&L to make smarter decisions about pricing, staffing, and expenses.
What a monthly restaurant P&L should include
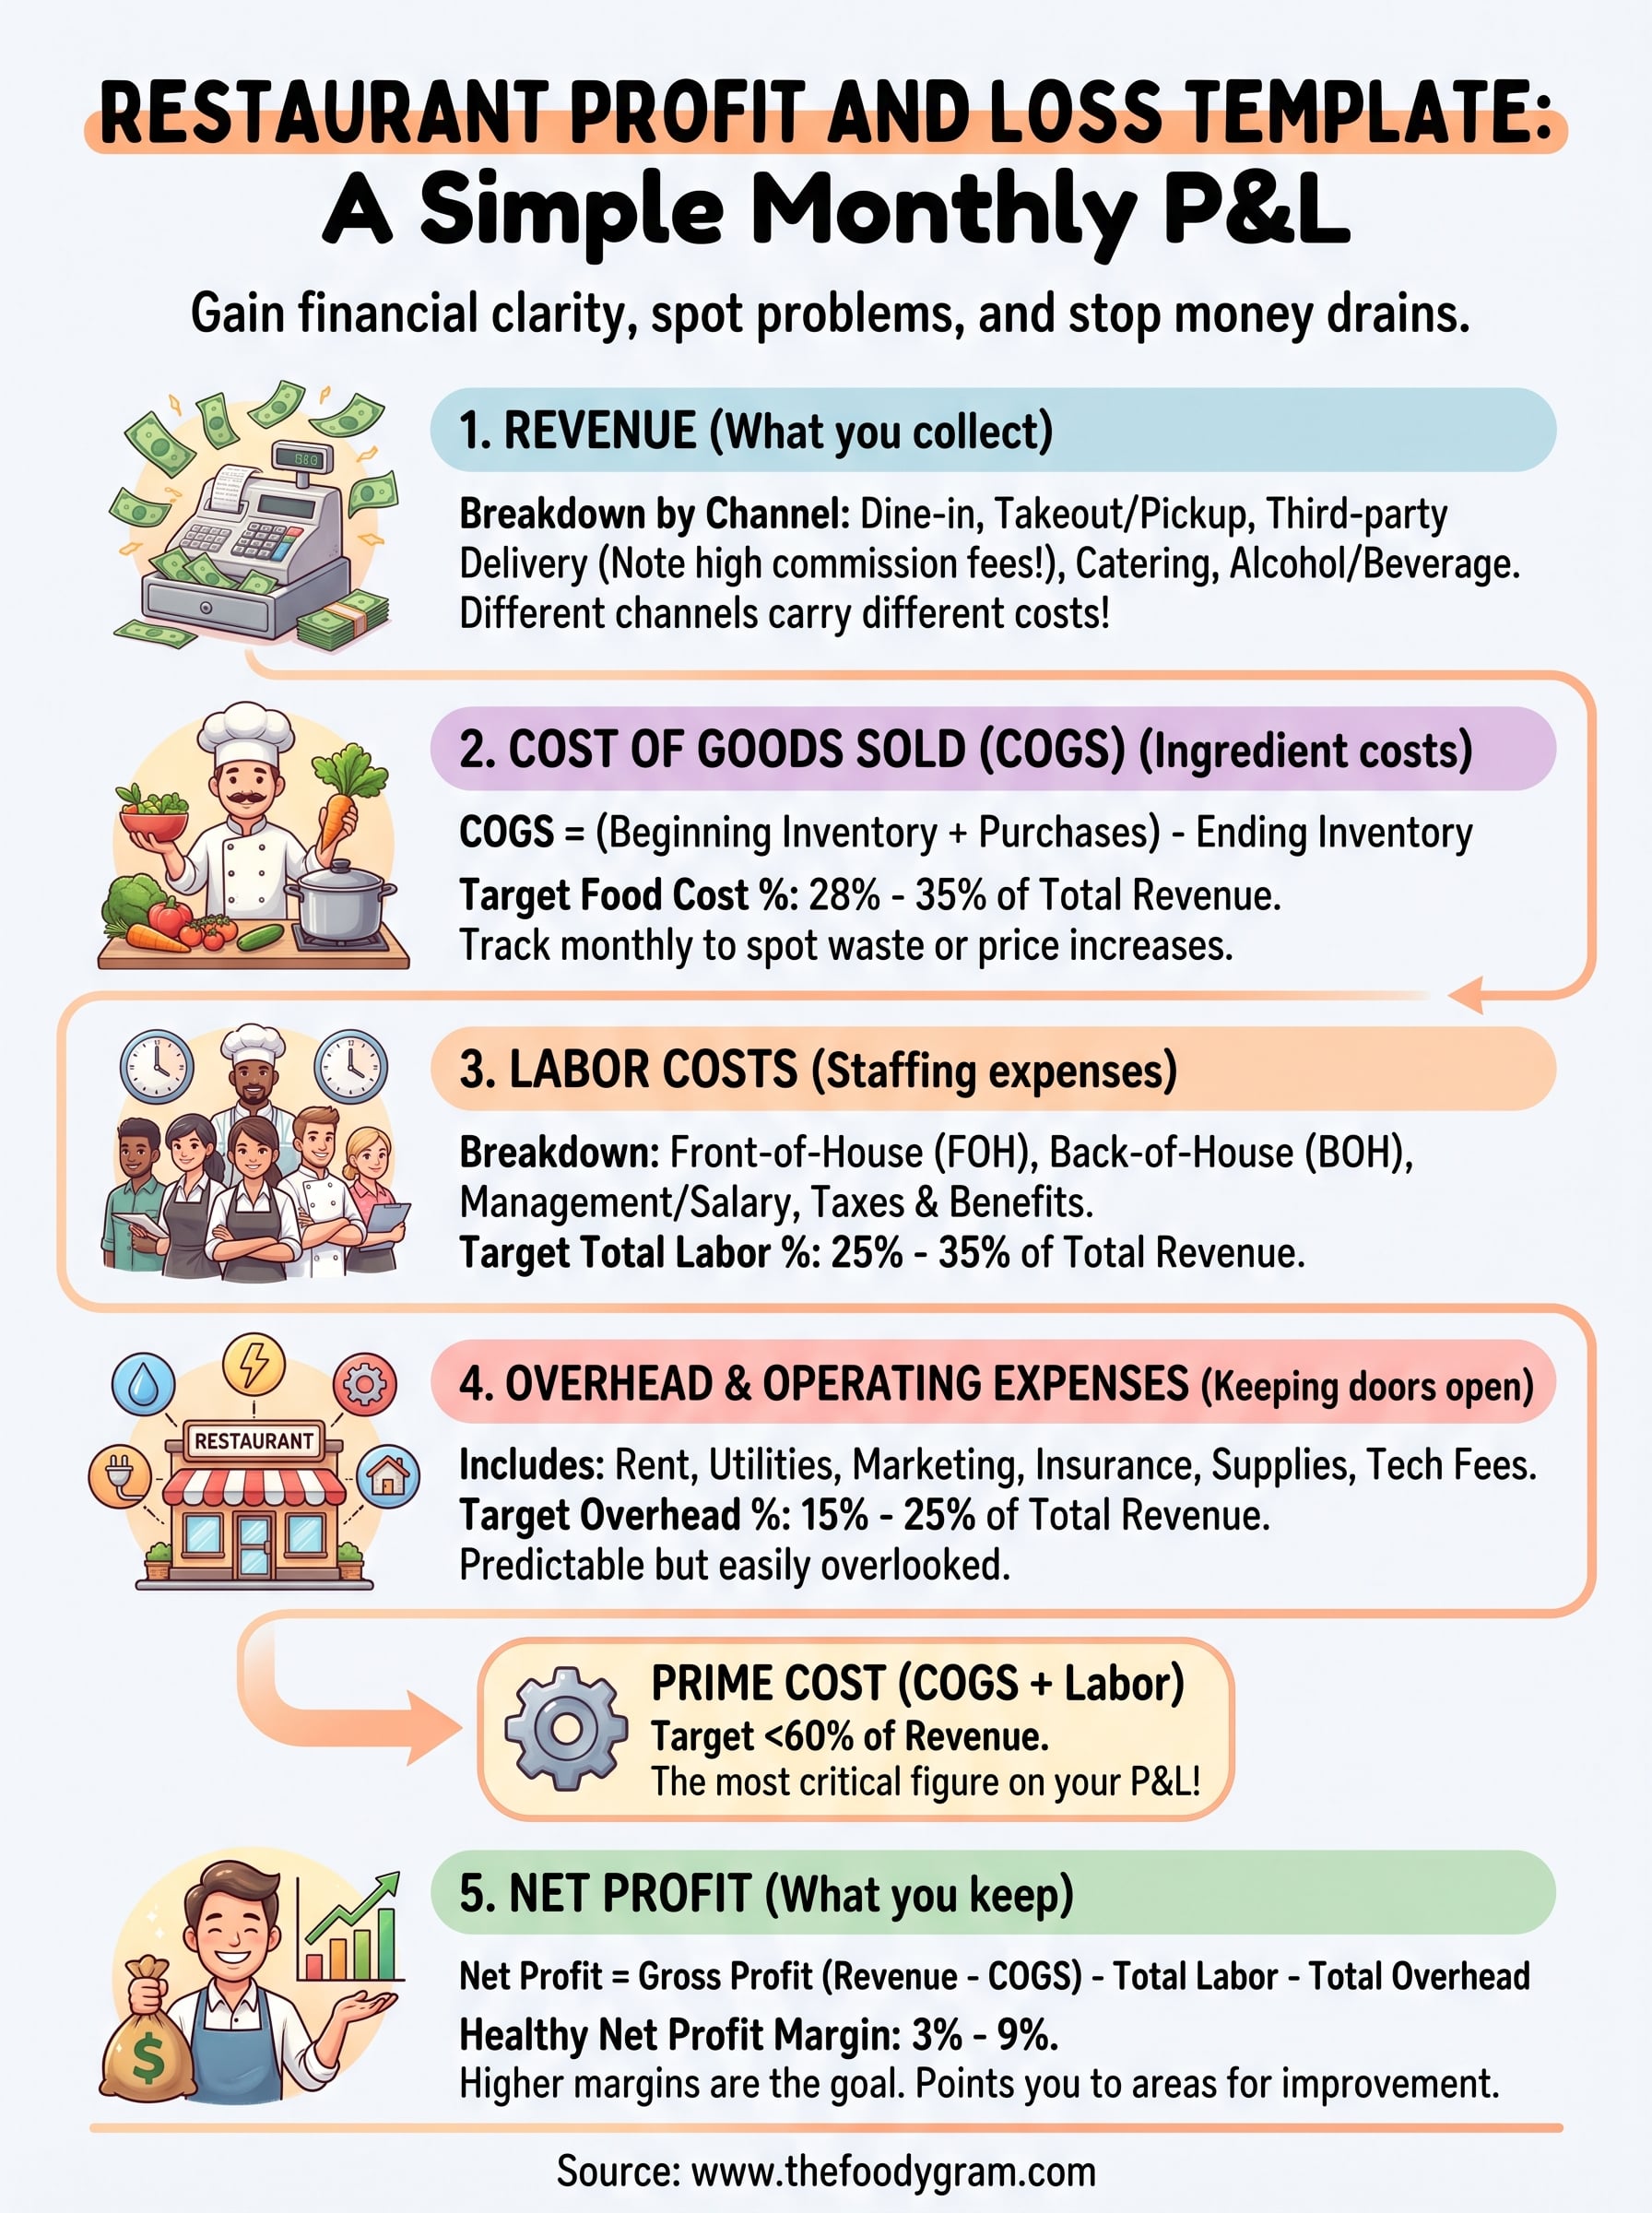
A well-built restaurant profit and loss template has five core sections. Each one captures a different layer of your business finances, and together they tell you whether your restaurant is making money or quietly losing it. Skip any section and you end up with a distorted picture that leads to bad decisions.
Revenue
Revenue is everything your restaurant collects before any expenses come out. Your template should break revenue into channels, not lump everything into a single total. Typical revenue categories include:
- Dine-in sales
- Takeout and pickup orders
- Delivery orders (direct and third-party, listed separately)
- Catering
- Alcohol and beverage sales
Tracking revenue by channel matters because different channels carry different costs. A delivery order through a third-party app might generate $40 in gross revenue but net you significantly less once commissions are applied. Knowing the number by channel lets you shift your strategy toward the orders that actually pay.
Cost of Goods Sold (COGS)
COGS is the total cost of the food and beverage ingredients you used to generate your sales. Your target food cost percentage should sit between 28% and 35% of total revenue for most restaurant types. You calculate it with this formula:
COGS = (Beginning Inventory + Purchases) - Ending Inventory
Track this number every single month. A spike in COGS usually points to waste, theft, or a supplier price increase you haven't yet built into your menu pricing.
Ignoring COGS fluctuations month-to-month is one of the fastest ways to watch your margins shrink without understanding why.
Labor Costs
Labor is typically your largest or second-largest expense, depending on your restaurant concept. Your P&L should capture all labor costs in one place, including hourly wages, salaried pay, payroll taxes, and benefits. The industry benchmark for total labor cost sits between 25% and 35% of revenue, though quick-service restaurants often run lower.
Break labor into at least two lines: front-of-house and back-of-house. That split shows you exactly where overtime and scheduling inefficiencies are hiding month to month.
Overhead and Operating Expenses
Overhead covers everything else it costs to keep your doors open. Your template should include line items for rent and utilities, marketing, supplies, equipment maintenance, insurance, and any technology or platform fees. These costs don't shift much with sales volume, which makes them easier to forecast but also easier to overlook.
Add up your overhead total and divide it by your total revenue. Most full-service restaurants run overhead between 15% and 25% of total revenue, so use that range as your benchmark.
Net Profit
Net profit is what remains after you subtract COGS, labor, and overhead from total revenue. Your net profit margin tells you what percentage of every dollar your restaurant actually keeps. A healthy range for most independent restaurants is 3% to 9%, with higher margins always being the goal.
When your margin falls outside that range, your P&L points you directly to the line item responsible, which is exactly why building this document correctly from the start saves you hours of guesswork later.
Step 1. Set up your template in a spreadsheet
Before you enter a single number, you need a clean structure that makes data entry fast and error-proof. Open a new spreadsheet in Google Sheets or Microsoft Excel and treat this file as your permanent monthly P&L. Name the file something like "Restaurant P&L 2026" and create a separate tab for each month so you can compare performance side by side over time.
Choose your tool
Google Sheets is the better starting point for most restaurant owners because it saves automatically, works on any device, and lets you share access with your accountant without emailing files back and forth. If you prefer Excel, the formulas are nearly identical, and the structure below works in both. Either way, you are building a living document you will return to every single month, so pick the tool you will actually open.
Build the core structure
Set up your spreadsheet with the following column layout: Column A for line-item labels, Column B for the current month's numbers, and Column C for a percentage-of-revenue calculation. The percentage column is critical because it lets you benchmark each expense against your total sales at a glance. Below is the row structure to follow:
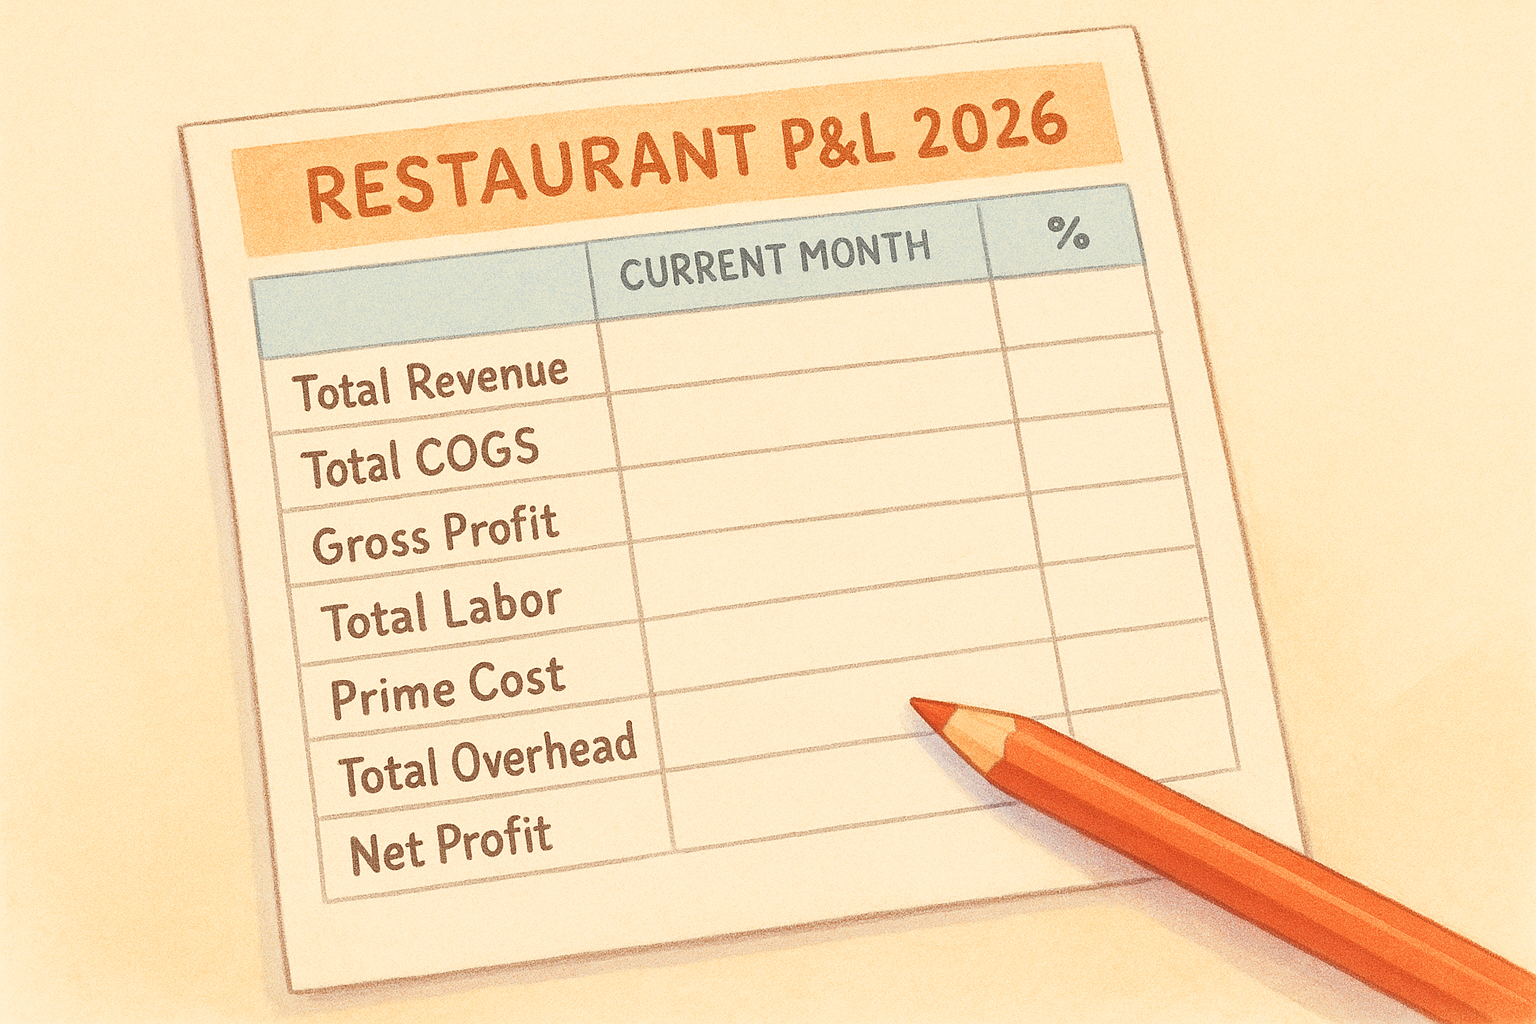
| Row | Label | Formula |
|---|---|---|
| 1 | Total Revenue | Sum of all revenue lines |
| 2 | Total COGS | Sum of food and beverage costs |
| 3 | Gross Profit | Revenue minus COGS |
| 4 | Total Labor | Sum of all labor costs |
| 5 | Prime Cost | COGS plus Labor |
| 6 | Total Overhead | Sum of all operating expenses |
| 7 | Net Profit | Gross Profit minus Labor minus Overhead |
Your percentage column is where the real insight lives. A raw dollar figure tells you what happened. A percentage tells you whether it is actually a problem.
Once this skeleton is in place, your restaurant profit and loss template is ready for real data. Every formula in Column C should divide the line-item value in Column B by your total revenue in Row 1, then format the cell as a percentage.
Step 2. Enter sales the right way each month
The most common mistake restaurant owners make when filling out their P&L is entering a single sales total at the top and moving on. That single number hides the information you actually need. Your restaurant profit and loss template only becomes useful when you break sales down into specific channels, because different revenue sources carry very different costs and margins.
Record sales by channel, not by total
Pull your numbers from three sources every month: your point-of-sale (POS) system, your direct online ordering platform, and any third-party delivery app dashboards you use. Each source should feed a separate line in your revenue section. A clean channel breakdown looks like this:
| Revenue Channel | Monthly Total | % of Total Revenue |
|---|---|---|
| Dine-in | $28,400 | 52% |
| Direct online orders | $14,200 | 26% |
| Third-party delivery (Uber Eats, DoorDash) | $7,600 | 14% |
| Catering | $3,800 | 7% |
| Beverage / Alcohol | $600 | 1% |
When you see third-party delivery as its own line, the commission cost you record later in your expenses hits differently. A $7,600 gross revenue line shrinking by 30% in fees is a concrete, visible problem you can actually act on.
Separating direct orders from third-party orders is the single most revealing thing you can do inside your revenue section.
Time your entries consistently
Enter your sales figures on the same day every month, ideally the first business day after the month closes. Consistency matters here because if you pull numbers mid-month for one period and wait three weeks for another, your month-over-month comparisons become meaningless. Set a recurring calendar reminder so this step never gets skipped.
Your POS report for the prior month is typically available the morning after you close out. Download it, cross-reference it against your online ordering totals, and enter both into your spreadsheet before you move on to anything else that day.
Step 3. Calculate COGS, labor, and prime cost
Once your revenue is entered correctly, your next job is to calculate the two biggest cost categories in your restaurant profit and loss template: cost of goods sold and labor. Together, these two numbers form your prime cost, which is the single most important figure on your entire P&L.
Calculate your COGS accurately
COGS is not simply what you spent on food orders this month. It accounts for what you actually used, which means you need to count your inventory. Use this formula every month without exception:
COGS = (Beginning Inventory + Purchases) - Ending Inventory
For example, if you started the month with $8,000 in inventory, purchased $22,000 in product, and ended with $6,500 on shelves, your COGS is $23,500. Divide that by your total revenue to get your food cost percentage. Most restaurants should target 28% to 35%. Anything above that signals waste, portioning problems, or supplier price increases that haven't hit your menu pricing yet.
Break down labor into categories
Enter your total labor costs as two separate lines in your spreadsheet: front-of-house (servers, hosts, bartenders) and back-of-house (cooks, dishwashers, kitchen leads). Below each line, include a third row that captures salaried management, payroll taxes, and any benefits. Your full labor entry should look like this:
| Labor Category | Monthly Cost | % of Revenue |
|---|---|---|
| Front-of-house hourly | $9,200 | 16.9% |
| Back-of-house hourly | $7,400 | 13.6% |
| Management / Salary | $4,800 | 8.8% |
| Payroll taxes and benefits | $2,100 | 3.9% |
| Total Labor | $23,500 | 43.2% |
Calculate prime cost and read the result
Prime cost = COGS + Total Labor. Using the examples above, that is $23,500 plus $23,500, which equals $47,000. Divide that by total revenue to get your prime cost percentage. Keep this number below 60% of revenue. Full-service restaurants often land between 55% and 60%, while quick-service concepts can push below 55%.
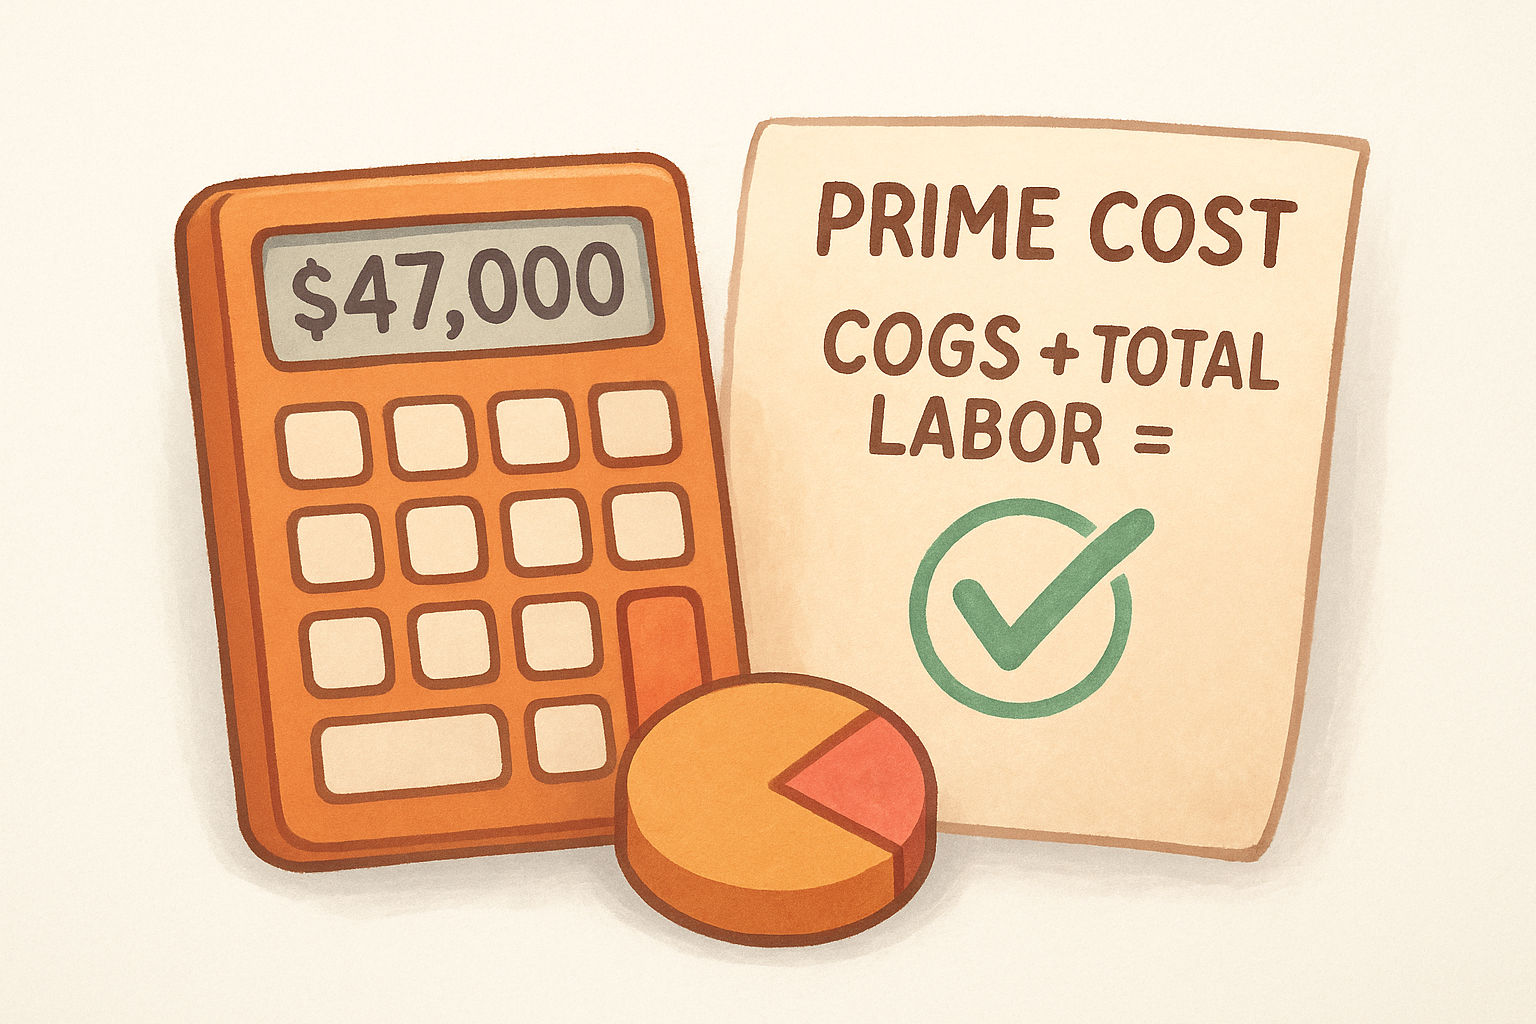
If your prime cost exceeds 65%, your restaurant has a structural margin problem that no amount of revenue growth will fix on its own.
Step 4. Add overhead and get to net profit
With your prime cost locked in, the last step in your restaurant profit and loss template is recording overhead expenses and calculating your final net profit. Overhead costs are predictable, but that predictability makes them easy to under-review. You need to capture every fixed and semi-variable expense before you can trust the bottom line number.
List every overhead line item
Enter each overhead expense as its own row in your spreadsheet. Grouping rent and utilities into one line looks cleaner but hides the detail you need when you're looking for cuts. Use this structure as your starting point:
| Overhead Category | Monthly Cost | % of Revenue |
|---|---|---|
| Rent / Lease | $6,500 | 11.9% |
| Utilities (gas, electric, water) | $1,800 | 3.3% |
| Insurance | $620 | 1.1% |
| Marketing and advertising | $900 | 1.7% |
| Technology and platform fees | $450 | 0.8% |
| Repairs and maintenance | $340 | 0.6% |
| Supplies (paper goods, cleaning) | $480 | 0.9% |
| Total Overhead | $11,090 | 20.3% |
Your total overhead percentage should stay between 15% and 25% of revenue for most independent restaurants. If any single category surprises you, that's the one to investigate first.
Calculate net profit and read your margin
Subtract your total labor and total overhead from gross profit to arrive at net profit. Written as a formula: Net Profit = Gross Profit - Total Labor - Total Overhead. Using the running example from earlier, that looks like this:
- Gross Profit: $30,900 (Revenue of $54,500 minus COGS of $23,500)
- Minus Total Labor: $23,500
- Minus Total Overhead: $11,090
- Net Profit: -$3,690
A negative net profit is not a reason to panic, but it is a clear signal that your prime cost or overhead structure needs immediate attention.
Divide your net profit by total revenue and multiply by 100 to get your net profit margin. A healthy independent restaurant targets 3% to 9%. Once you see where you land, your P&L tells you exactly which line items to cut, reprice, or renegotiate.
Your next move
Your restaurant profit and loss template is only as useful as the habits you build around it. Set a recurring reminder for the first business day of each month, pull your POS and ordering platform reports, and fill in every section using the structure from this guide. One hour a month gives you a clear, consistent financial picture that most independent restaurant owners never have.
Once your P&L starts showing a pattern, the next logical question is where your revenue is actually coming from and what it costs you to collect it. If third-party delivery commissions are eating a significant percentage of your sales line every month, that expense is worth eliminating. The Foody Gram replaces those commission fees with a flat monthly subscription, so more of your revenue stays on the bottom line. Check out our commission-free online ordering plans to see what that looks like for your restaurant.