

How To Calculate Restaurant Profit Margin (Gross & Net) 2026
Most restaurant owners can tell you their revenue off the top of their head. Far fewer can tell you their actual profit margin, and that gap is where businesses quietly bleed money. Knowing how to calculate restaurant profit margin is one of the most fundamental skills you need as an owner, yet it's one that often gets buried under the daily chaos of running a kitchen. Whether your numbers are healthy or hurting, you can't fix what you can't measure.
This guide breaks down both gross and net profit margin formulas, walks you through real examples, and gives you 2026 industry benchmarks so you can see exactly where your restaurant stands. We'll also cover the specific cost categories that have the biggest impact on your bottom line, and where you might be leaving money on the table without realizing it.
One of those hidden profit killers? Third-party delivery commissions. Platforms like Uber Eats and DoorDash can take up to 30% per order, which directly eats into the margins you're about to calculate. That's exactly why we built The Foody Gram, a commission-free online ordering system that lets restaurants keep their revenue through a flat monthly fee instead. But before we get into solutions, let's start with the math. Because once you understand your margins clearly, every business decision gets sharper.
What restaurant profit margin measures
Profit margin tells you what percentage of your revenue you actually keep after paying your costs. It's a ratio, not a raw dollar figure, which makes it far more useful for diagnosing the health of your business than revenue alone. A restaurant doing $2 million in annual sales but operating at a 2% net margin is in a much weaker position than one doing $800,000 at a 15% margin. Understanding what margin measures is the foundation of knowing how to calculate restaurant profit margin correctly, and it's the starting point before any formula makes practical sense.
Gross profit margin vs. net profit margin
These two numbers measure different layers of your business, and you need both. Gross profit margin looks at how much revenue you keep after subtracting only your Cost of Goods Sold (COGS), which is the direct cost of the food and beverages you sell. It tells you whether your menu pricing and food costs are under control, but it does not factor in rent, labor, utilities, or any other operating expense.
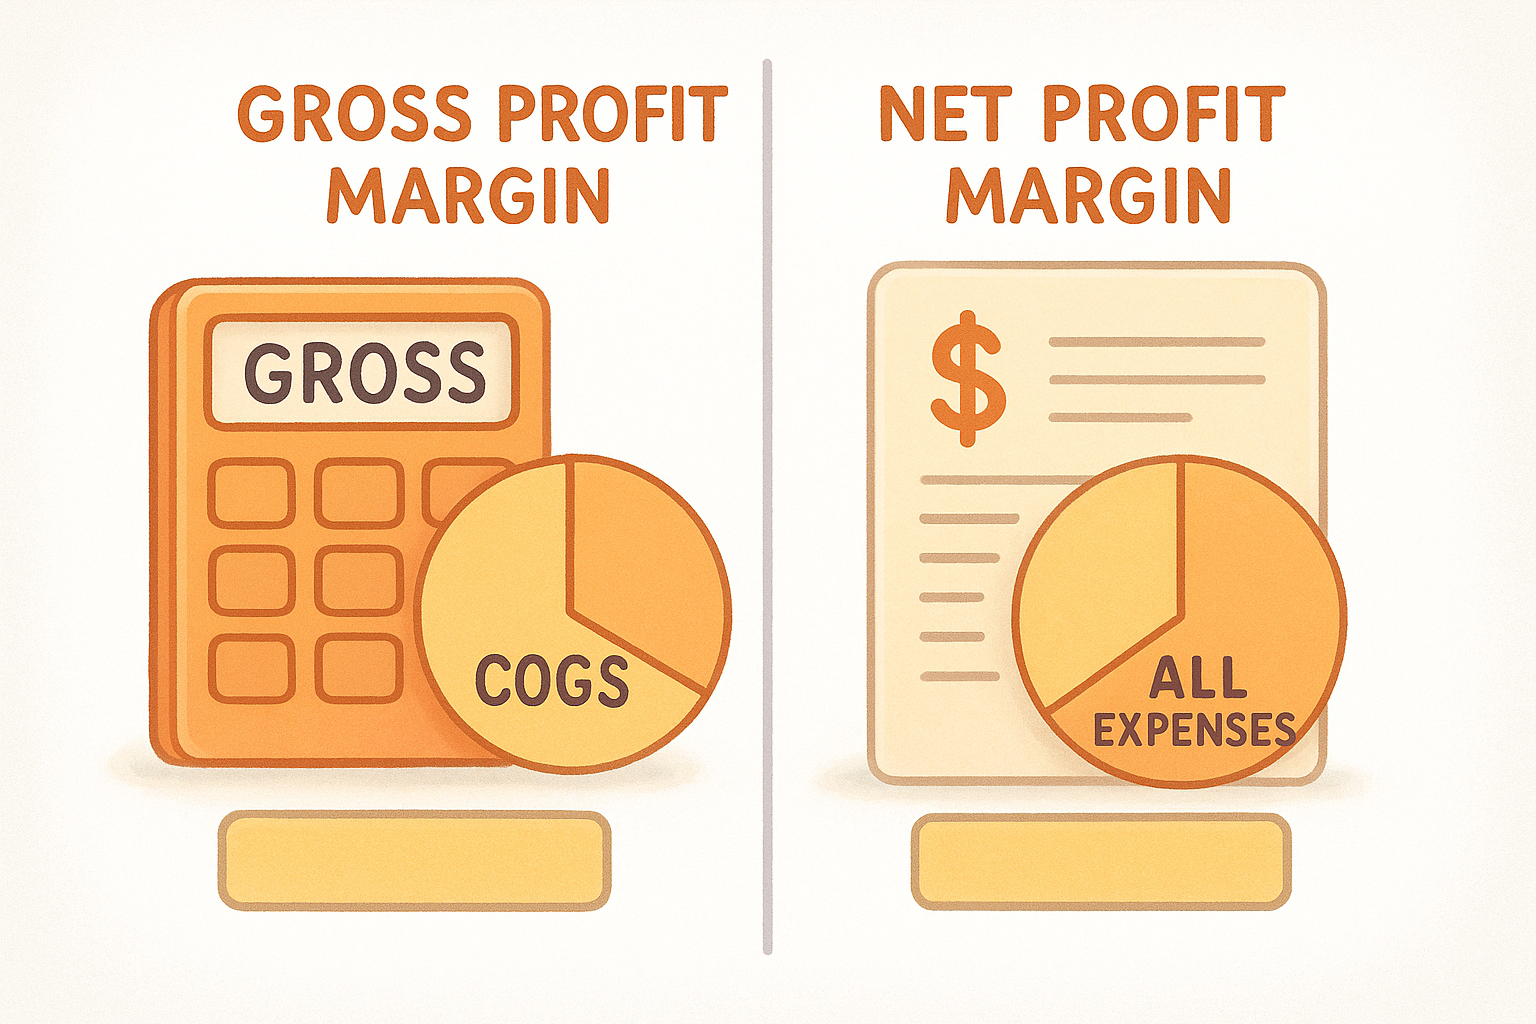
Net profit margin goes further and subtracts every operating expense from revenue, including labor, rent, marketing, software, delivery fees, and miscellaneous overhead. This is the number that tells you whether your business is actually profitable. Most conversations about restaurant finances focus on net profit margin because it reflects the real financial outcome of running your operation, not just how efficiently you purchase and price ingredients. Both numbers matter at different points in your analysis, which is why this guide walks through each one separately.
Here's a quick side-by-side to make the distinction clear:
| Metric | What it subtracts | What it tells you |
|---|---|---|
| Gross profit margin | COGS only | Food cost and menu pricing efficiency |
| Net profit margin | All operating expenses | True business profitability |
Why margin matters more than revenue
Revenue is a vanity number if you don't know how much of it you keep. Two restaurants on the same block can have identical monthly sales and wildly different financial outcomes, entirely based on how they manage their cost structure. High revenue with poor margins means you're working harder for less return, and that pattern is what forces restaurants to close even when they appear busy from the outside.
Margin is the number that tells you whether growth actually helps you, or just makes your problems bigger at scale.
Tracking margin also gives you a clear benchmark for every operational decision you make. If you're considering a new menu item, signing a delivery partnership, or bringing on an extra line cook, your margin is the lens that tells you whether that move makes financial sense. Without it, you're making decisions on instinct rather than data. Restaurants that monitor margins consistently are far better equipped to catch when costs are creeping up, whether that's from food waste, over-ordering, or third-party platform fees that quietly reduce your take on every single order.
Understanding what these margins measure sets you up to use the formulas correctly in the steps that follow. Once you know what each number represents, the math becomes straightforward.
Step 1. Collect the right numbers from your P and L
Before you can calculate anything, you need accurate inputs. The formula only works if the data you feed it reflects your actual business, not rough estimates or guesses. Pull your Profit and Loss statement (P&L) for the time period you want to analyze, whether that's the past month, quarter, or full year. If you don't have one, your accountant or POS system can generate it. This is your starting point for learning how to calculate restaurant profit margin with real numbers, and the quality of those numbers determines how useful your result actually is.
Revenue: your starting line
Total revenue is every dollar your restaurant brought in during the period you're measuring. This figure includes dine-in sales, takeout, delivery, catering, and any other income streams your business generates. Do not confuse this with cash collected; use your gross sales figure before any refunds or voids, then subtract those separately if your P&L tracks them that way. Your POS system should report this number directly, so use that as your source rather than bank deposits.
The more accurately you capture every revenue channel, the more reliable your margin calculation will be.
Cost categories to pull
Once you have revenue, you need two layers of costs. The first is Cost of Goods Sold (COGS), which covers every ingredient and beverage used to produce what you sold. The second layer is your total operating expenses, which includes everything else it takes to run the business day to day.
Here is exactly what to collect from your P&L:
| Category | What to include |
|---|---|
| Total Revenue | All sales channels combined |
| COGS | Food costs, beverage costs, packaging |
| Labor | Wages, salaries, payroll taxes, benefits |
| Rent | Base rent, CAM charges, property taxes |
| Utilities | Gas, electric, water, trash |
| Marketing | Ads, promotions, third-party platform fees |
| Other Operating | Insurance, supplies, software, repairs |
Collect every figure for the same time period so your comparison stays accurate. Mixing a full year of revenue against one month of expenses produces a number that means nothing. Once every line is filled in and your P&L reflects a single consistent period, you're ready to run the calculations in the steps that follow.
Step 2. Calculate gross profit margin
Gross profit margin is the first number you calculate because it isolates food cost and menu pricing from every other variable in your business. It answers one specific question: after you pay for the ingredients that went into every dish and drink you sold, how much revenue do you have left? This is the metric that tells you whether your menu is priced correctly relative to what it costs to produce. If your gross margin is weak, you have a food cost problem, and no amount of operational efficiency will fully compensate for it.
The gross profit margin formula
The calculation itself is straightforward once you have your revenue and COGS figures ready from Step 1. Here is the formula:
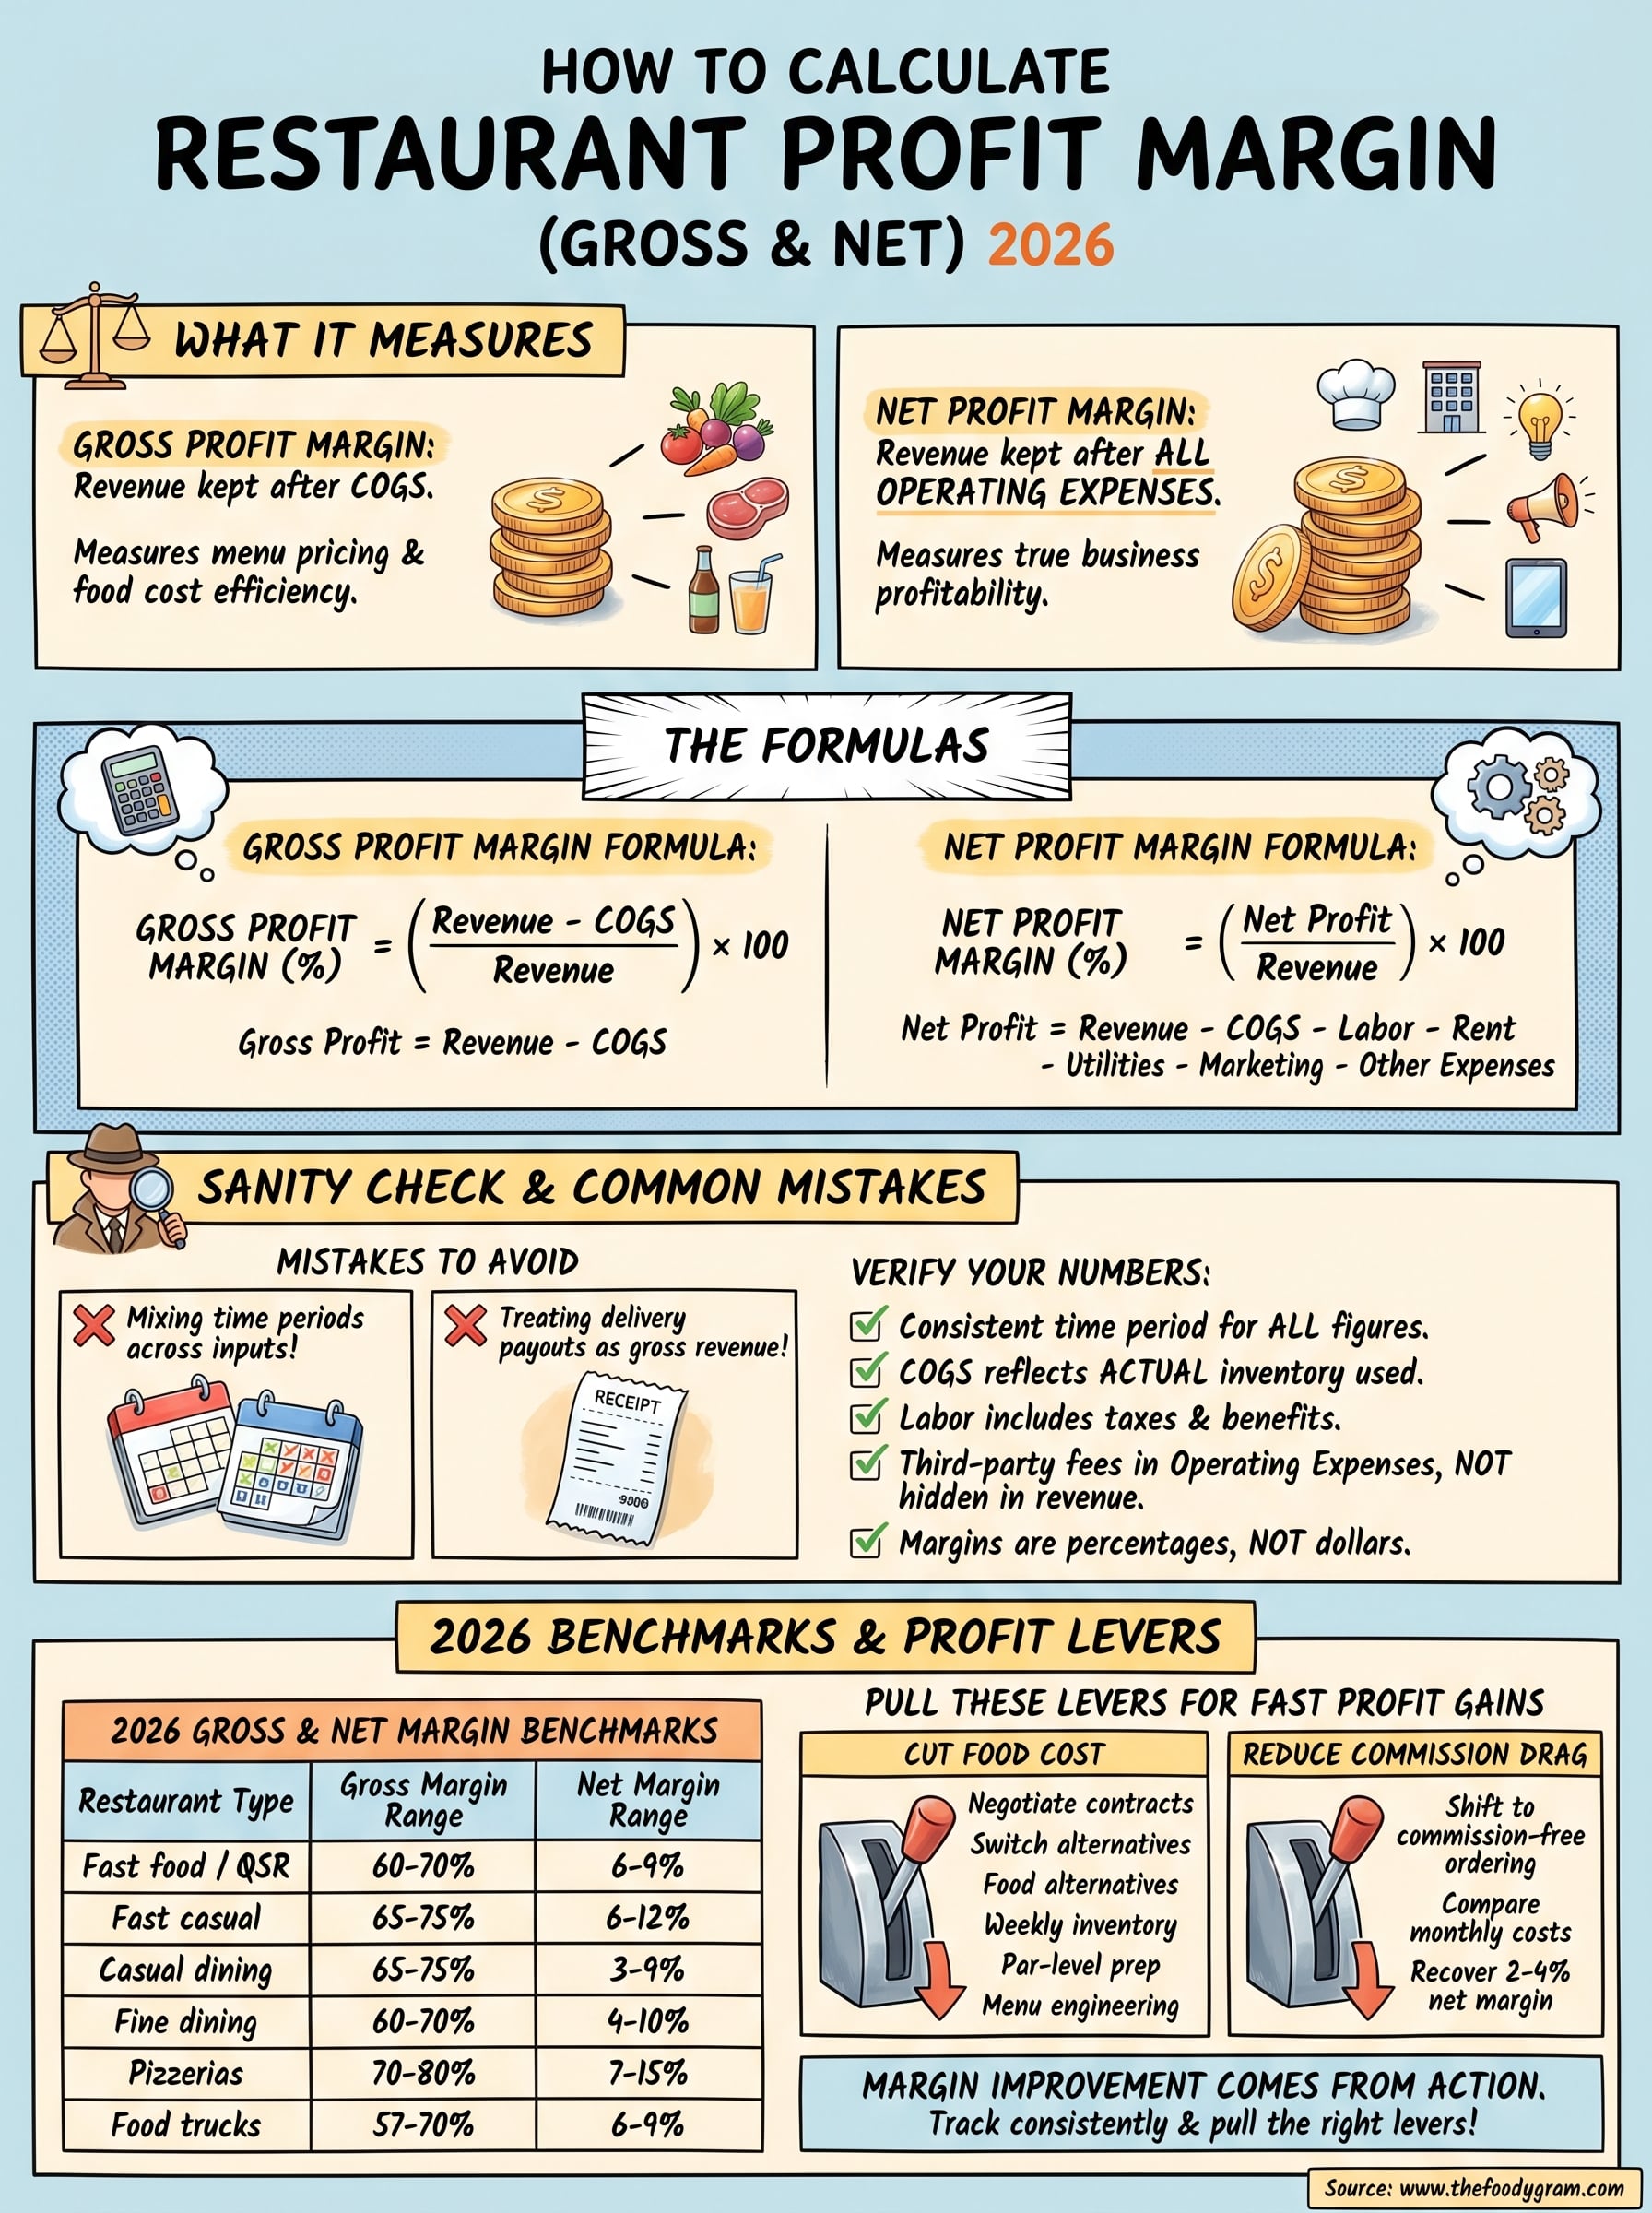
Gross Profit Margin (%) = ((Revenue - COGS) / Revenue) × 100
Gross profit is simply your revenue minus COGS. Gross profit margin expresses that dollar figure as a percentage of revenue, which is the number you actually want to track and compare over time. Run this calculation for a full month at minimum, since a single week can carry too much noise from slow days or unusual orders to give you a reliable reading.
Gross margin percentage is more useful than gross profit dollars because it stays comparable even as your revenue grows or shrinks.
A worked example
Walk through this with real numbers to see how to calculate restaurant profit margin at the gross level. Suppose your restaurant brought in $85,000 in total revenue last month and your COGS, covering all food and beverage costs, came to $27,200.
| Input | Amount |
|---|---|
| Total Revenue | $85,000 |
| COGS | $27,200 |
| Gross Profit | $57,800 |
| Gross Profit Margin | 68% |
The math: ($85,000 - $27,200) / $85,000 × 100 = 68%. That result sits in a healthy range for most restaurant types, which you will verify against benchmarks in Step 5. If your number comes back significantly lower, the next move is to audit your food cost percentages by category to find which items are dragging the average down.
Step 3. Calculate net profit margin
Net profit margin is the number that tells you what your business actually earns after every cost is accounted for. Unlike gross margin, which only subtracts food costs, net margin pulls in labor, rent, utilities, marketing, software subscriptions, third-party platform fees, and everything else you spend to keep the restaurant running. This is the figure investors, lenders, and serious operators focus on because it reflects the true financial outcome of your business, not just your purchasing efficiency. Knowing how to calculate restaurant profit margin at the net level gives you the clearest picture of whether your operation is sustainable.
The net profit margin formula
Start with the same revenue figure you used in Step 2, then subtract all operating expenses rather than just COGS. Your net profit is what remains after every line item on your P&L is paid.
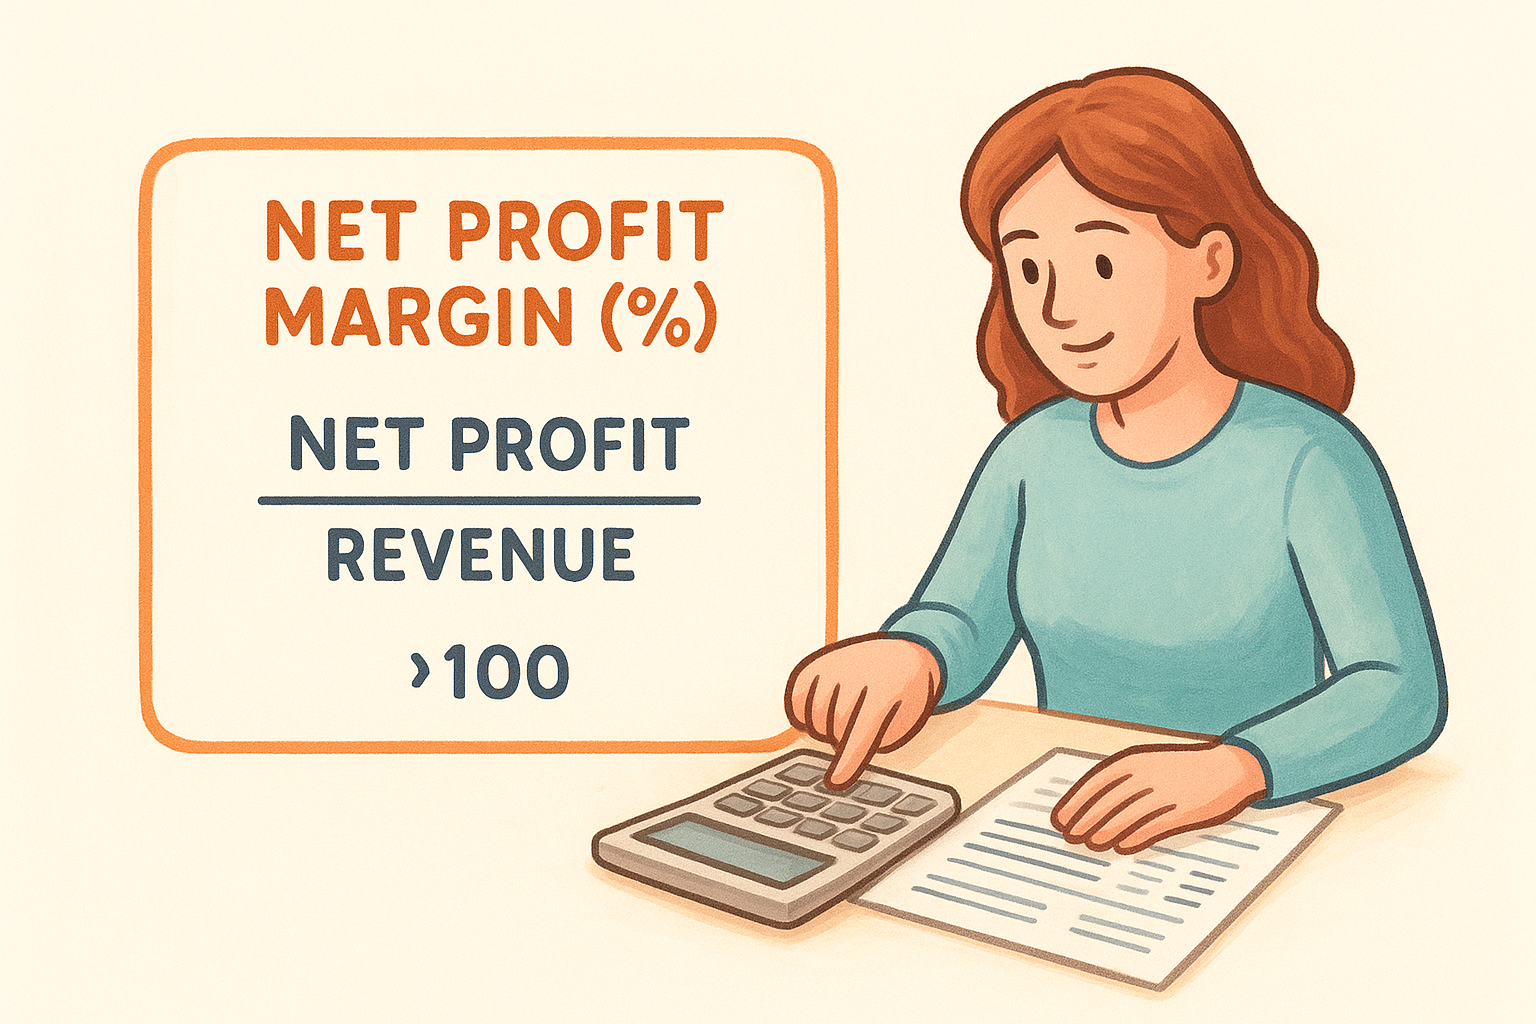
Net Profit Margin (%) = (Net Profit / Revenue) × 100

Net Profit = Revenue - COGS - Labor - Rent - Utilities - Marketing - Other Operating Expenses
Once you have your net profit margin, you can compare it directly against industry benchmarks to understand where your restaurant actually stands relative to similar operations.
Run this calculation using the same time period you used for your gross margin so your numbers stay consistent and comparable. Monthly is the minimum cadence that makes sense, since quarterly and annual figures can mask seasonal swings that need attention.
A worked example
Use the same restaurant from Step 2, which brought in $85,000 in revenue and had $27,200 in COGS. Now add the remaining operating costs to complete the net margin calculation.
| Expense Category | Amount |
|---|---|
| Revenue | $85,000 |
| COGS | $27,200 |
| Labor | $28,900 |
| Rent | $7,500 |
| Utilities | $2,100 |
| Marketing | $1,800 |
| Other Operating | $1,400 |
| Net Profit | $16,100 |
| Net Profit Margin | 18.9% |
The math: $16,100 / $85,000 × 100 = 18.9%. That result is strong by most restaurant standards. A smaller net margin, say under 5%, signals that operating costs are consuming too large a share of revenue and require immediate attention before you move into unprofitability.
Step 4. Sanity-check your math and avoid common mistakes
Even with the right formulas in hand, small errors in your inputs or structure can produce margin numbers that look fine on paper but don't reflect your actual business. Before you act on any figure you calculate, run a quick verification pass. Catching a bad input takes minutes; making decisions based on a wrong margin can cost you thousands. This step covers the most common mistakes restaurant owners make when learning how to calculate restaurant profit margin, and gives you a practical checklist to confirm your math before moving on.
Common calculation errors to catch
The most frequent mistake is mixing up time periods across your inputs. If your revenue figure covers a full month but your labor costs only reflect three weeks of payroll, your net margin will look artificially high. Every single number on your P&L must represent the exact same date range, or the result is meaningless.
Consistent time periods are not optional, they are the foundation of any margin calculation you can actually trust.
A second common error is treating delivery platform payouts as gross revenue instead of adjusting for commissions first. If DoorDash or Uber Eats takes 25-30% per order and you log the full sale price rather than what you actually received, your revenue line is inflated and your margin looks healthier than it is. Use your actual deposit or payout amount, not the customer-facing order total.
How to verify your numbers
Run this quick checklist against your P&L before you finalize any margin figure:
- Revenue and all expense categories cover the same calendar period
- COGS reflects actual inventory used, not inventory purchased (account for waste and spoilage)
- Labor includes payroll taxes and any benefits, not just gross wages
- Third-party platform fees appear in your marketing or operating expenses and are not hidden inside a net revenue figure
- Your gross profit margin and net profit margin are both expressed as percentages, not dollar amounts
Once every item on this list checks out, your numbers are ready to compare against the industry benchmarks in the next step. Skipping this verification is the step that turns a useful calculation into a misleading one.
Step 5. Compare your margin to 2026 benchmarks
Now that your calculations are verified, you need a reference point to interpret what your numbers actually mean. Calculating margin in isolation tells you the math but not the story. Benchmarks give your numbers context so you can determine whether your operation is performing well, lagging behind similar restaurants, or genuinely outperforming the industry. Without this comparison, a 7% net margin could seem either alarming or impressive depending on your format, and you'd have no way to know which.
2026 gross and net margin benchmarks by restaurant type
Restaurant margins vary significantly by format and service model, which is why you should compare your results to operations similar to yours rather than treating the industry as a single average. The table below reflects 2026 benchmark ranges for the most common restaurant types based on typical cost structures across each format.
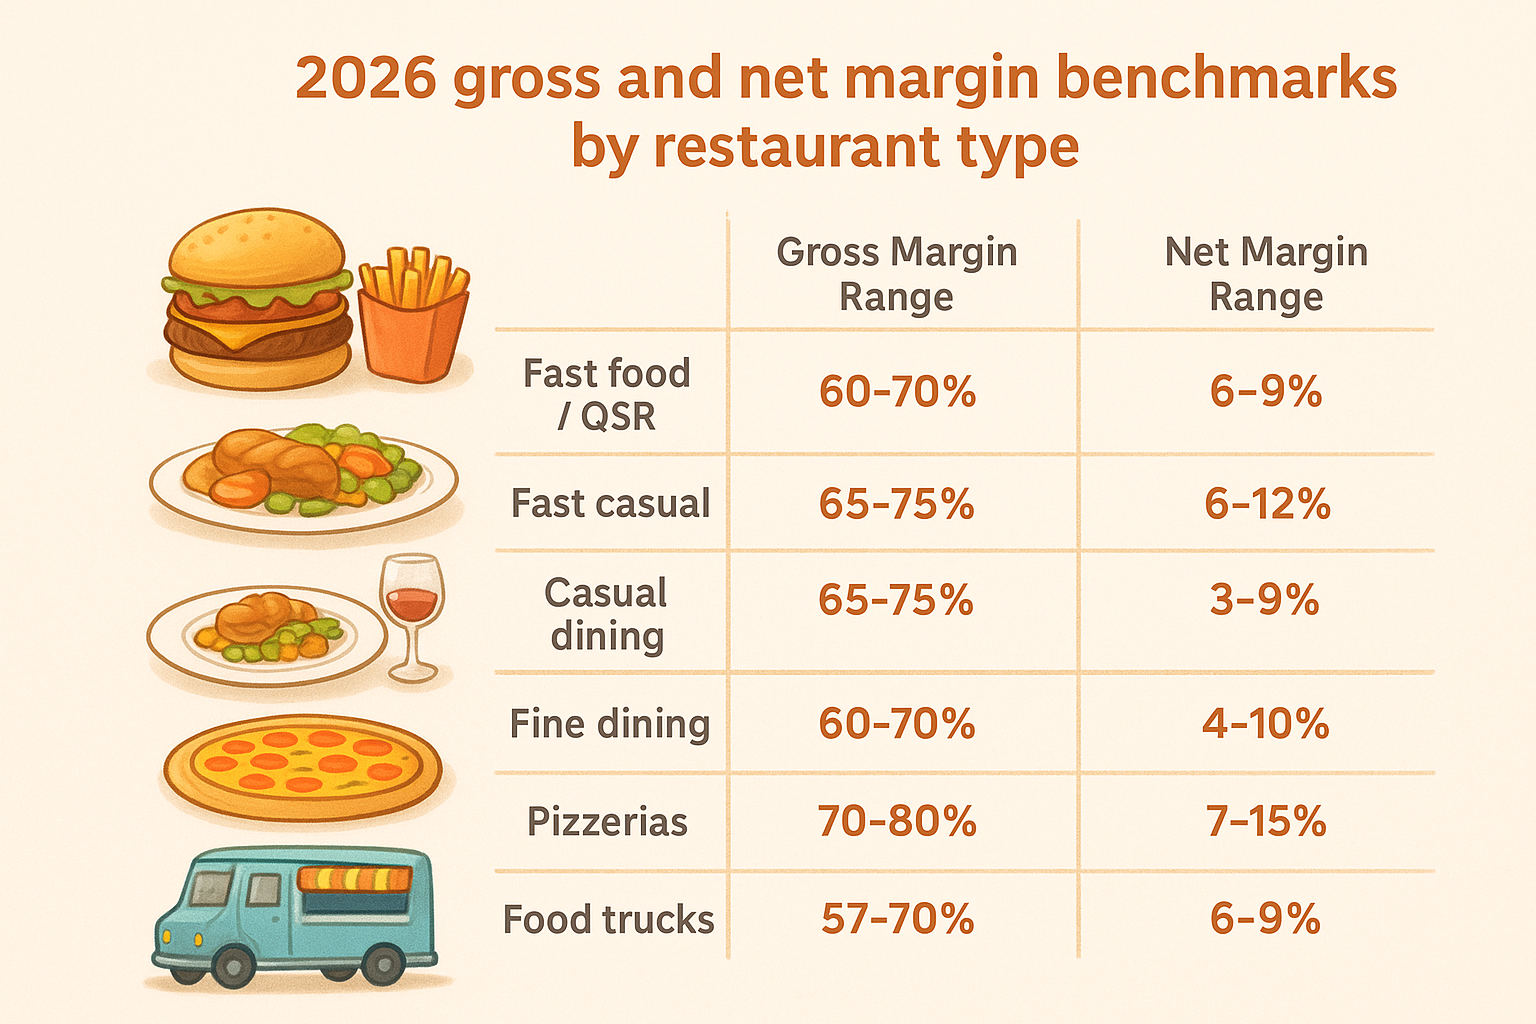
| Restaurant Type | Gross Margin Range | Net Margin Range |
|---|---|---|
| Fast food / QSR | 60-70% | 6-9% |
| Fast casual | 65-75% | 6-12% |
| Casual dining | 65-75% | 3-9% |
| Fine dining | 60-70% | 4-10% |
| Pizzerias | 70-80% | 7-15% |
| Food trucks | 57-70% | 6-9% |
Your gross margin sitting below these ranges almost always points to a menu pricing or food cost problem, while a weak net margin typically signals labor, rent, or third-party fees eating too large a share.
Use these ranges as a directional guide, not a rigid pass or fail line. Regional cost differences, your specific lease terms, and your local labor market all affect where your margin realistically lands. A restaurant in a high-rent urban market may never reach the top of these ranges even with disciplined cost control, while a well-run suburban location can exceed them.
What to do when your margin falls short
If working through how to calculate restaurant profit margin reveals you're running below benchmark, your first move is to isolate which cost category is furthest out of range. Pull your COGS percentage and labor percentage as separate figures and compare each one to standard targets for your restaurant type. One category is almost always doing the most damage, and that's where your energy belongs.
For most restaurants, third-party delivery commissions represent the single fastest opportunity to recover margin. A platform taking 25-30% per order can shift your net margin by two to three full percentage points in a single high-volume month, and that impact compounds as your order volume grows.
Step 6. Use margin levers to raise profit fast
Once you know how to calculate restaurant profit margin and you have your verified numbers in hand, the next move is to act on them. Margin improvement comes from pulling specific levers, not from making vague commitments to "cut costs." Each lever targets a distinct cost category, and the fastest gains almost always come from the two areas that consume the largest share of restaurant revenue: food cost and delivery platform fees.
Cut food cost without cutting quality
Your COGS is the most controllable expense on your P&L because you can adjust it without changing your service model, hiring decisions, or lease terms. The goal is to lower your food cost percentage while maintaining or improving the quality your customers expect. Start by auditing your menu for items where the ingredient cost exceeds 30-35% of the menu price, then adjust pricing, portion size, or supplier terms on those specific items first.
Small food cost reductions compound quickly across high-volume items, and a two-point improvement in COGS percentage often translates directly to the same two-point gain in net margin.
Here are the most effective food cost levers to apply immediately:
- Negotiate supplier contracts on your top five ingredients by spend, not by volume
- Switch high-cost proteins to spec-equivalent alternatives that maintain dish quality
- Implement weekly inventory counts to catch waste and over-ordering before they compound
- Introduce a par-level system for prep to reduce spoilage on perishables
- Engineer your menu to highlight high-margin items in prime visual positions
Reduce commission drag from delivery platforms
Third-party delivery fees are one of the fastest margin killers in the current restaurant environment. A platform charging 25-30% per order does not just reduce your payout on that sale; it lowers your effective net margin across every order that flows through it. Shifting even a portion of your delivery volume to a commission-free direct ordering channel can recover two to four percentage points of net margin depending on your current order mix. Calculate what your monthly commission spend totals, then compare that figure against what a flat monthly subscription model would cost you. The difference is often significant enough to change your margin category entirely, moving you from below benchmark to solidly within range.
Keep your margins in reach
Now that you know how to calculate restaurant profit margin at both the gross and net level, the real work is making sure those numbers improve over time. Margin does not fix itself through good intentions. It improves when you pull specific levers consistently: tightening food costs, managing labor against your sales volume, and cutting the fees that quietly reduce your take on every order you fulfill. Every percentage point you recover goes straight to your bottom line, which means the math you ran in this guide has a direct dollar value attached to it.
Third-party delivery commissions are one of the fastest levers available to you right now. Replacing even part of that order volume with a commission-free channel shifts your margin without requiring operational changes. If you want to see what a flat monthly subscription costs compared to what you currently pay in commissions, review our pricing options and run the numbers yourself.