

Restaurant Operating Costs Breakdown: Benchmarks & Tips
Most restaurant owners can tell you their rent and food costs off the top of their head. But when you lay out a full restaurant operating costs breakdown, the numbers often tell a different story than expected. Expenses you barely think about, credit card processing fees, third-party delivery commissions, linen services, equipment maintenance, quietly stack up and squeeze margins thinner every month.
The average restaurant operates on profit margins between 3% and 9%. That leaves almost no room for waste, surprises, or costs you haven't accounted for. Yet many operators still rely on gut feelings instead of benchmarks when evaluating where their money actually goes. Knowing your numbers isn't optional if you want to stay open past year two.
This guide breaks down every major cost category restaurants face, from food and labor to occupancy, technology, and marketing. You'll find current industry benchmarks for each, so you can compare your spending against realistic standards. We also cover practical ways to reduce costs without cutting corners on quality or service. As a platform built specifically to help restaurants eliminate commission fees on online orders, The Foody Gram sees firsthand how even a single line-item change can shift a restaurant's bottom line. That perspective shapes every recommendation in this article.
Let's get into the numbers.
Why restaurant operating costs matter
Running a restaurant means managing dozens of cost categories simultaneously, each pulling at a profit margin that rarely exceeds single digits. The industry average sits between 3% and 9%, but that range masks a harder truth: most restaurants that fail don't fail because they lack customers. They fail because they lose track of where the money goes. Understanding your full restaurant operating costs breakdown is the foundation for every smart financial decision you'll make as an owner.
The real profit margin problem
A restaurant doing $500,000 in annual revenue can still lose money if costs aren't controlled. Most owners focus heavily on food cost because it's visible and tangible, but labor, occupancy, and technology costs often combine to outpace it. The math is unforgiving at thin margins. If your total costs sit at 95% of revenue, you're working hard for a 5% return. One bad month, an equipment breakdown, or an unexpected rent increase can push that figure below zero.
A restaurant earning $1 million in annual revenue at a 5% profit margin takes home $50,000. A 2% increase in untracked costs wipes out $20,000 of that.
Knowing your total monthly expenses down to the line item isn't about being paranoid. It's about catching cost problems before they compound. Many operators only discover an issue when they check their bank balance at month's end, by which point the damage is already done. The goal is to spot the drift early, not after it's already taken a bite out of the bottom line.
What happens when costs go untracked
When you don't monitor individual cost categories, small inefficiencies multiply fast. A restaurant running food cost at 34% instead of the industry benchmark of 28-32% might not feel the gap week to week, but over a year that difference represents thousands of dollars in lost margin. The same logic applies to labor hour creep, where scheduled shifts expand gradually without anyone flagging it.
Your menu prices should reflect your actual cost structure. If your costs rise but your prices stay flat, you absorb the difference directly out of margin. Tracking costs by category gives you the data to make timely, evidence-based pricing decisions rather than reactive guesses when the pressure is already on.
How benchmarks help you make better decisions
Industry benchmarks exist because enough restaurants have measured their costs over time to establish what "healthy" looks like across different expense categories. Knowing that food cost should typically run 28-35% of revenue gives you a target to aim for. Knowing that labor benchmarks land between 25-35% tells you when to look harder at your scheduling practices. Without benchmarks, you're evaluating your own numbers in a vacuum with no reference point.
Benchmarks also give you a clear framework for prioritizing where to focus your improvement efforts. If your food cost sits at 30% but your labor cost is running at 40%, you know immediately where to direct attention first. If your occupancy cost is consuming 15% of revenue instead of the 5-10% typical for the industry, that tells you something important about whether your current location can ever be financially sustainable. You don't need to hit every benchmark perfectly, but knowing them means you're always asking the right questions about your own operation rather than flying blind on cost decisions that directly determine whether your restaurant stays profitable.
Fixed, variable, and semi-variable costs
Before you can do a useful restaurant operating costs breakdown, you need to understand how costs behave. Not all expenses respond the same way to changes in your sales volume. Some stay the same no matter how many covers you do; others move directly with revenue. Sorting your costs into the right buckets gives you a clearer picture of what you can control and when.
Fixed costs
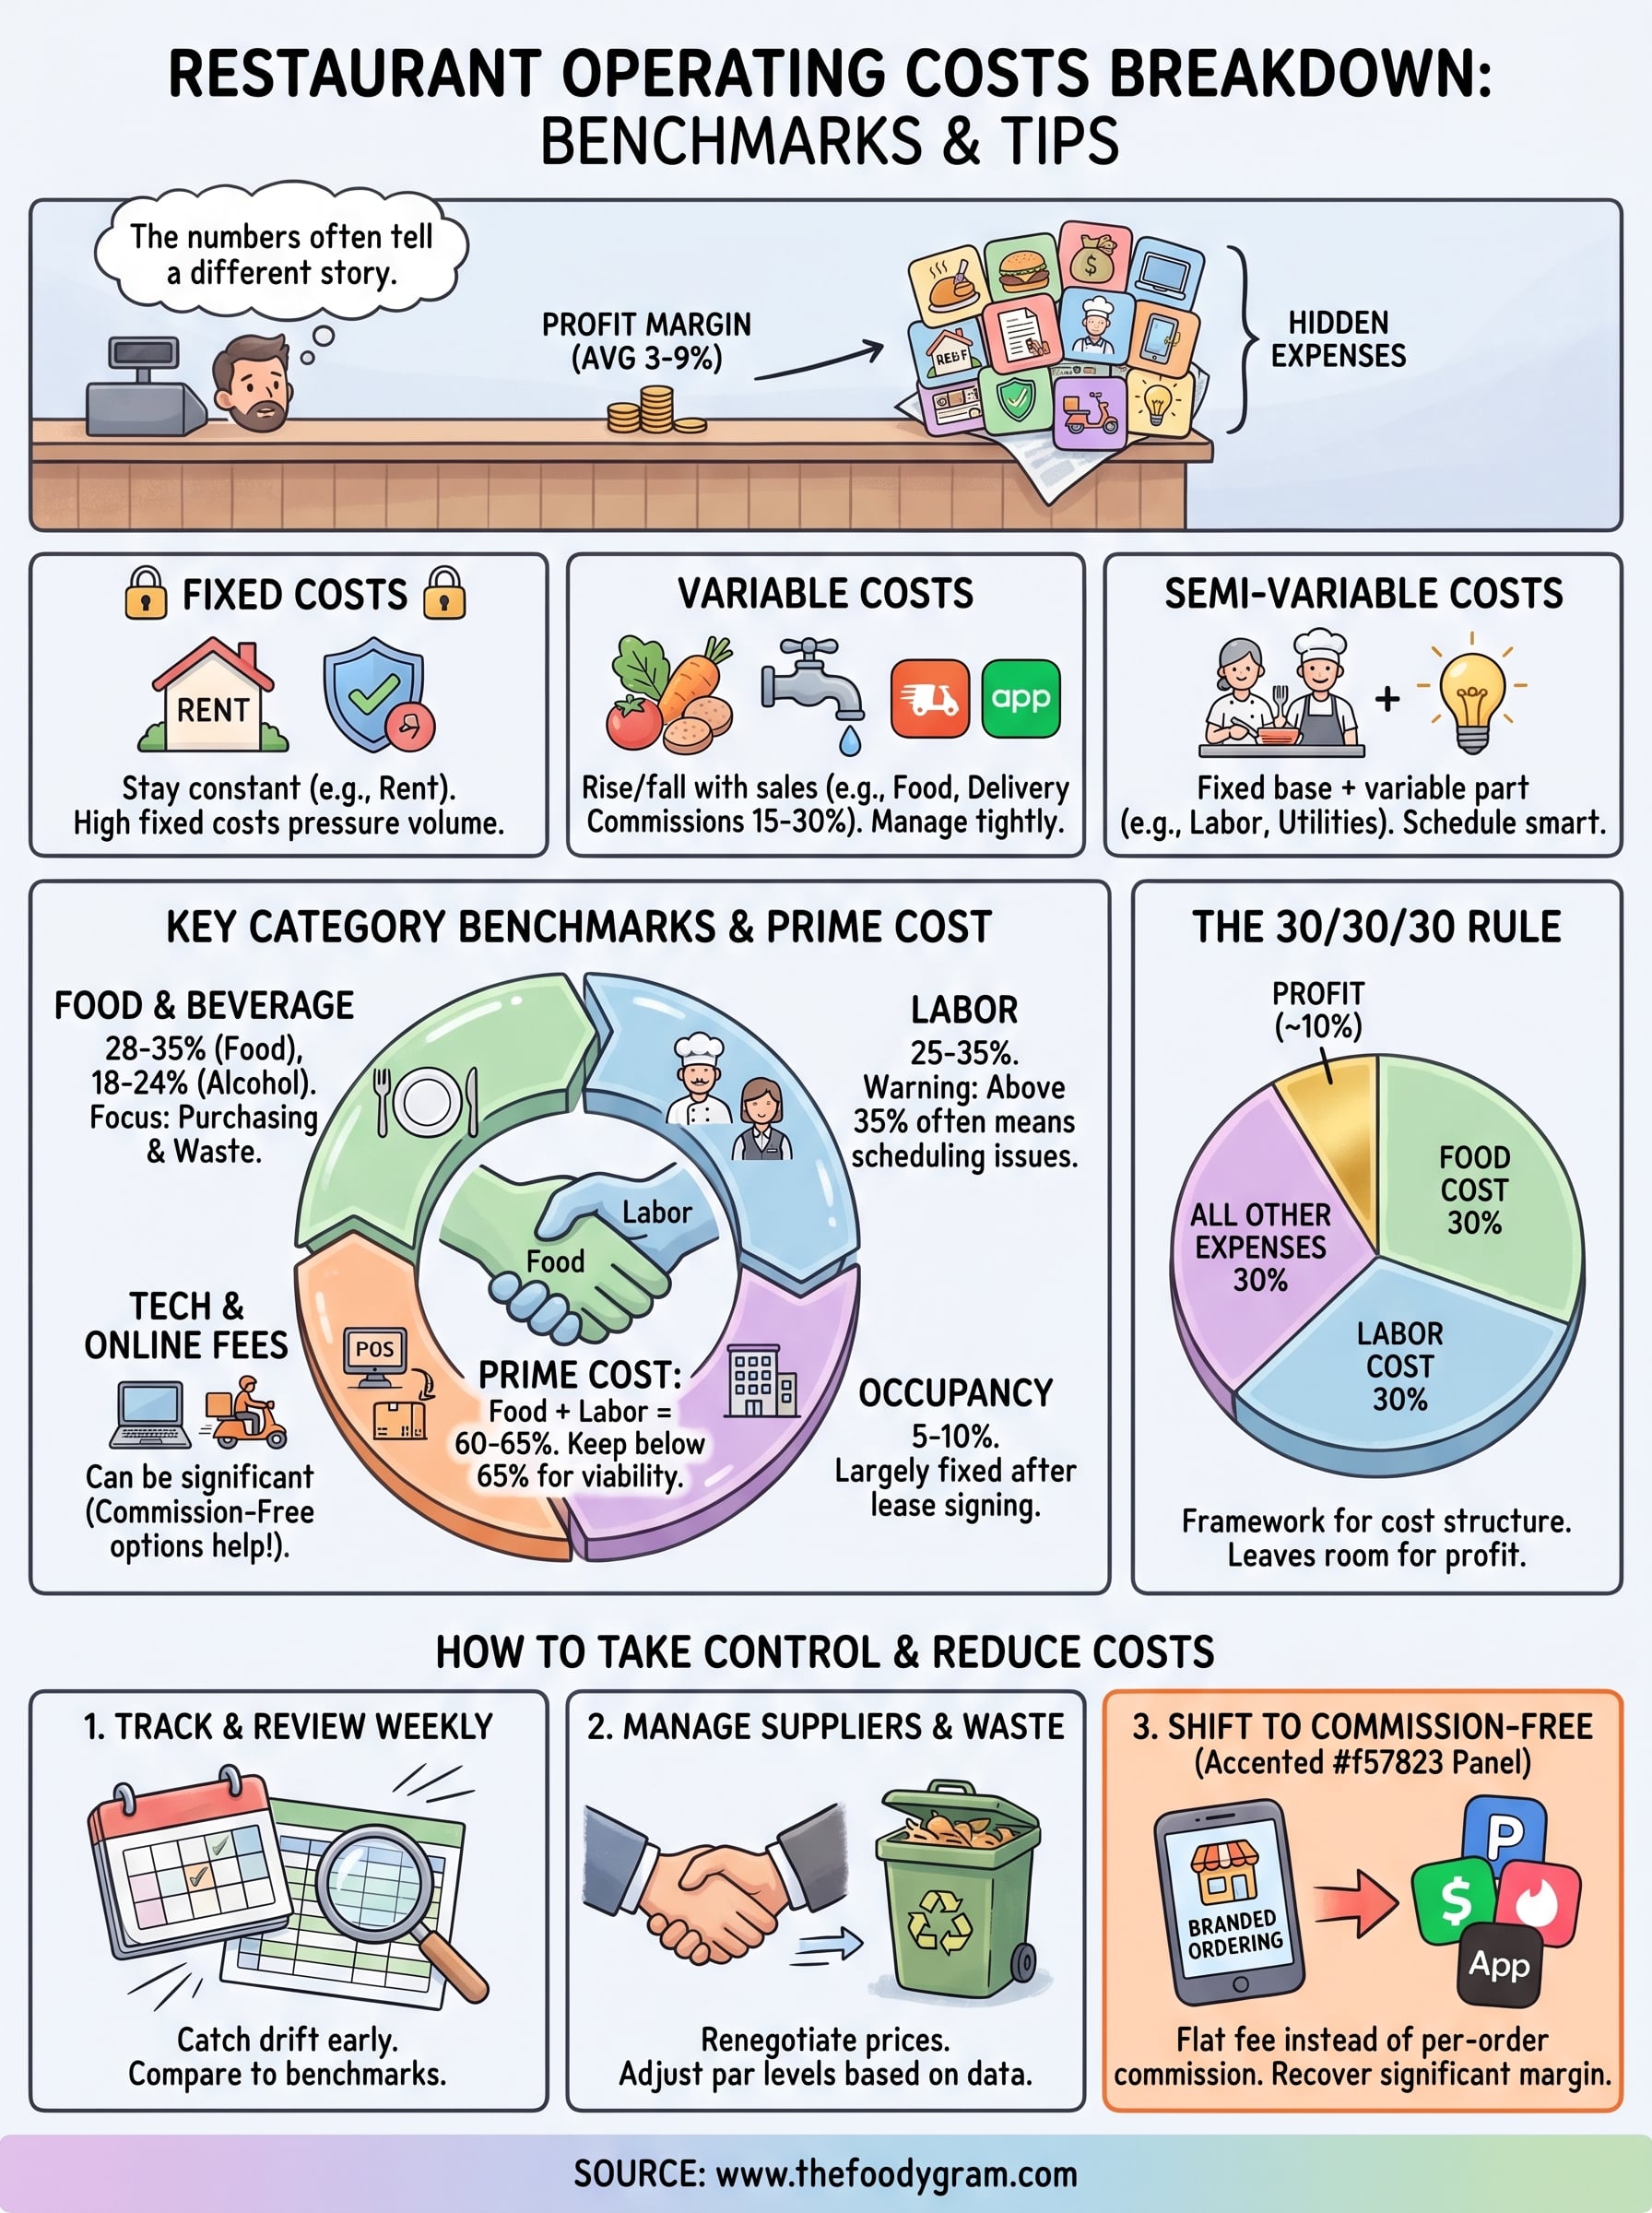
Fixed costs are expenses that stay constant every month regardless of how much business you do. Your rent is the clearest example. Whether you serve 200 guests or 2,000 in a given month, your landlord expects the same check. Insurance premiums, loan payments, and software subscriptions all fall into this category as well.
The important thing about fixed costs is that your sales volume directly determines how hard they hit your margins. A $10,000 monthly rent represents 10% of revenue when you're doing $100,000 in sales, but 20% of revenue if sales drop to $50,000. High fixed costs create pressure to keep your volume up consistently, which is why location decisions and lease negotiations carry so much long-term weight.
Variable costs
Variable costs rise and fall with your sales volume. Food and beverage costs are the most direct example here. The more you sell, the more ingredients you use, and the higher this number climbs. Credit card processing fees and delivery commissions also fall into this category because they scale with every transaction.
Third-party delivery apps typically charge commissions between 15% and 30% per order, which means your variable cost load grows every time you generate more sales through those platforms.
Variable costs give you more room to maneuver than fixed costs, but they also require closer monitoring. Your food cost percentage can shift based on supplier pricing, menu mix, waste levels, and portioning practices. Tracking cost per dish and waste by category helps you keep variable expenses from quietly drifting upward.
Semi-variable costs
Semi-variable costs have both a fixed component and a variable one. Labor is the most common example in a restaurant context. You'll always need a minimum crew on the floor and in the kitchen regardless of sales, but you also schedule additional staff when volume is higher. Utilities work similarly: you pay a baseline to keep the lights on and the equipment running, but energy usage increases meaningfully during high-volume service periods.
Understanding which costs are semi-variable helps you make smarter staffing and scheduling decisions. You can't cut your way to zero on these expenses, but you can manage the variable portion tightly when sales dip.
Restaurant operating cost categories and benchmarks
A proper restaurant operating costs breakdown covers more than food and rent. Each category below represents a distinct slice of your revenue, and understanding the industry benchmark for each one gives you a concrete standard to measure your own operation against. Some of these numbers will surprise you.
Food and beverage costs
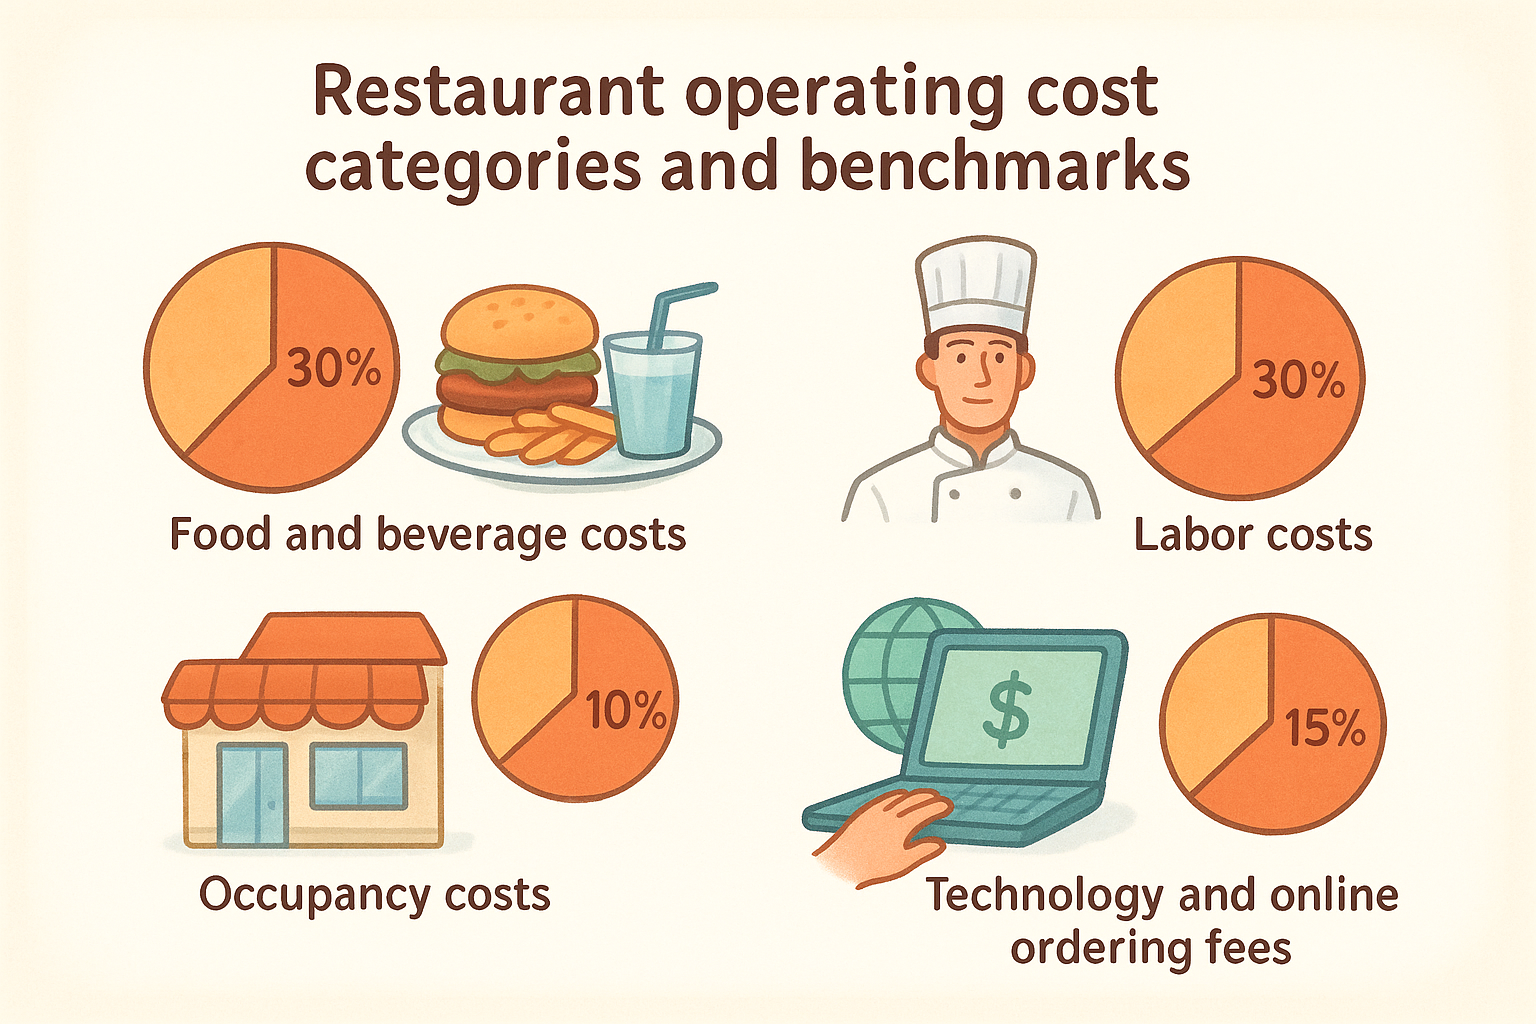
Food cost is the most watched number in any restaurant, and for good reason. It directly reflects purchasing efficiency, portion control, and waste management all at once. The standard benchmark for food cost runs between 28% and 35% of revenue, though fine dining establishments often run lower and fast-casual concepts sometimes push higher depending on their menu design.
Beverage cost typically runs lower than food cost. Alcohol cost benchmarks sit around 18-24%, while non-alcoholic beverages tend to fall even further below that. Tracking these two separately gives you a sharper view of where your margins are strongest.
Labor costs
Labor is frequently the single largest cost category a restaurant carries. This includes wages, payroll taxes, benefits, and workers' compensation insurance for all employees, not just your kitchen staff. The industry benchmark for total labor cost lands between 25% and 35% of revenue, though quick-service formats often operate closer to the lower end of that range.
When labor cost consistently exceeds 35% of revenue, it usually signals a scheduling problem, a menu pricing problem, or both.
Overtime hours and high turnover both push labor costs up fast. Tracking labor as a percentage of daily revenue rather than just a dollar amount helps you catch drift before it accumulates into a monthly problem.
Occupancy costs
Occupancy covers your rent or mortgage, property taxes, and common area maintenance charges. The healthy benchmark sits between 5% and 10% of revenue. Anything above that range puts serious pressure on your overall cost structure and limits how much room you have to absorb other expenses.
Your occupancy cost percentage is largely fixed once you sign a lease, which is why location analysis before signing matters enormously. A space that looks affordable at $5,000 per month becomes a margin problem fast if your sales volume can't support it.
Technology and online ordering fees
This category has grown significantly over the past decade. Point-of-sale systems, inventory software, and reservation platforms each carry monthly fees that add up quietly. More critically, third-party delivery commissions typically range from 15% to 30% per order, which means this line item can rival or exceed your food cost percentage on high delivery-volume days. Tracking it separately from other technology expenses makes the true impact visible.
Prime cost and the 30 30 30 rule
Prime cost is one of the most important figures in any restaurant operating costs breakdown. It combines your two largest expense categories into a single number you can track every week.
What prime cost is
Prime cost equals your total food and beverage cost plus your total labor cost for a given period. That's it. No rent, no utilities, no marketing expenses. Just those two categories combined into one metric. The industry benchmark for prime cost lands at 60-65% of total revenue. If your prime cost sits above 65%, your restaurant is almost certainly struggling to generate meaningful profit, regardless of your sales volume.
A prime cost at or below 60% gives you 40 cents of every revenue dollar to cover all other expenses and generate profit.
The 30 30 30 rule explained
The 30 30 30 rule breaks your revenue into three roughly equal spending buckets: 30% for food cost, 30% for labor cost, and 30% for all other operating expenses. That leaves 10% for profit, which aligns closely with the upper end of what high-performing independent restaurants actually achieve. The rule isn't a strict law, but it gives you a clear and memorable framework to build your cost structure around.
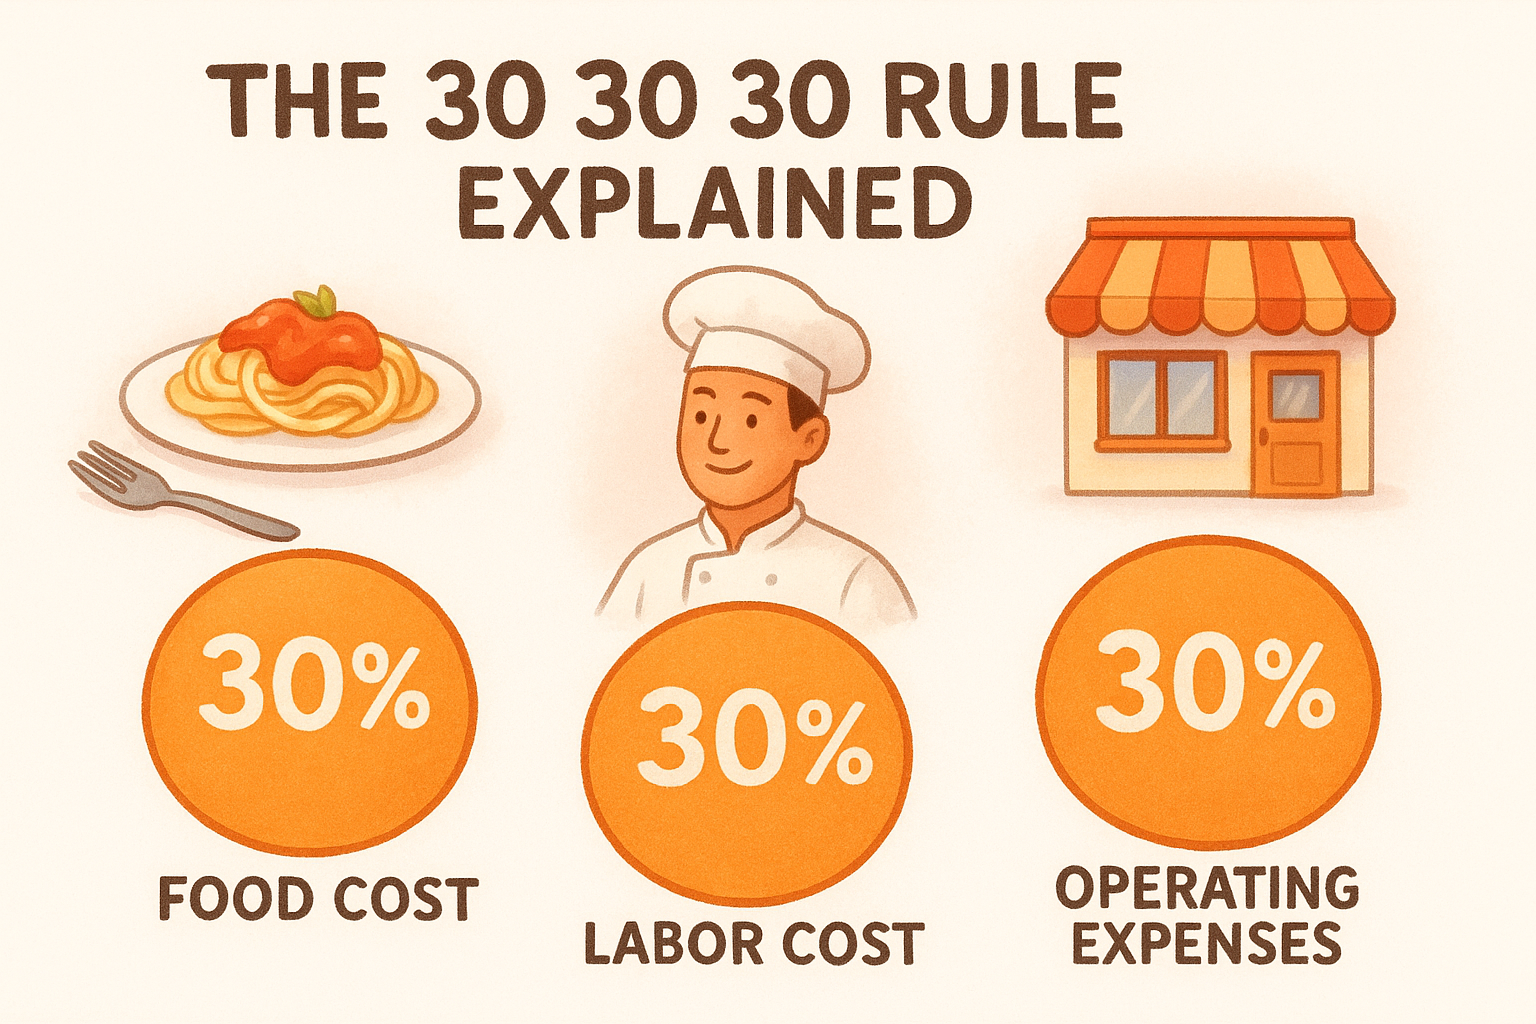
Each of the three 30% buckets requires a different management approach. Food cost responds to purchasing decisions, portion control, and menu engineering, while labor cost responds to scheduling discipline and accurate sales forecasting. The third bucket covers everything else in your cost structure: occupancy, utilities, marketing, insurance, and technology fees. Keeping that combined "everything else" figure at or below 30% requires the same line-item attention you already give food and labor.
Why these numbers matter for your restaurant
Most operators track food cost and labor cost as separate figures and evaluate them independently. The value of combining them into prime cost is that it shows you the combined weight of your two heaviest expenses against revenue in a single glance. If food cost creeps up by 2% and labor cost creeps up by 2% at the same time, you might not notice either drift in isolation. But prime cost rising from 62% to 66% makes the problem impossible to miss.
Reviewing your prime cost weekly rather than monthly puts you in a position to catch problems while they're still small. Daily sales data paired with weekly labor and food cost totals gives you enough information to identify which week went sideways and why, before a monthly review reveals damage that's already accumulated.
How to calculate and track operating costs
Running a useful restaurant operating costs breakdown starts with a simple formula: total operating costs divided by total revenue, multiplied by 100. That gives you your operating cost percentage for any period, whether it's a week, a month, or a quarter. Most operators find weekly calculations more actionable than monthly ones because they let you catch problems while the data is still fresh enough to act on.
The basic formula you need
Your total operating cost is the sum of every expense category your restaurant carries: food, labor, occupancy, utilities, marketing, technology, and miscellaneous costs. Add them all together and divide by your gross revenue for the same period. If your combined expenses for the month total $85,000 and your revenue was $100,000, your operating cost percentage sits at 85%, leaving a 15% margin before taxes.
Tracking each cost category as its own percentage of revenue, not just as a dollar amount, lets you compare your numbers against industry benchmarks directly.
Breaking the formula down by category rather than running it as a single combined figure gives you the specificity to actually identify where problems exist. A restaurant running at 90% total operating cost needs to know whether the problem lives in food purchasing, labor scheduling, or somewhere else entirely. Category-level percentages point you to the right answer faster than a single composite number ever will.
Setting up a tracking system
You don't need expensive software to start tracking costs effectively. A spreadsheet with consistent weekly inputs for each cost category gives you enough data to identify trends over time. Most point-of-sale systems export daily sales totals you can pull directly into your tracker. On the cost side, your invoices, payroll reports, and utility bills provide the raw inputs. The key is entering data on a fixed schedule rather than whenever it feels convenient.
As your volume grows, dedicated restaurant accounting software can automate much of this work and generate cost percentage reports automatically. The discipline of tracking matters more than the tool you use to do it, especially when you're starting out.
Reviewing costs on a consistent schedule
Weekly reviews work better than monthly reviews because small cost problems compound quickly when left unexamined. Set aside time every week to compare your actual cost percentages against your benchmarks and against the prior week. If a category spikes, investigate immediately rather than waiting to see if it corrects on its own.
Monthly reviews serve a different purpose: they give you a broader view of seasonal trends and help you evaluate whether price adjustments or supplier negotiations are needed at a structural level.
How to reduce costs without cutting corners
Reducing costs in a restaurant doesn't mean serving smaller portions or hiring fewer people than you need. A smarter restaurant operating costs breakdown shows you exactly which categories are out of line with benchmarks, and those are the only places you need to focus. Cutting the right expenses in the right places protects your margins without touching the quality your customers already count on.
Renegotiate supplier relationships and reduce waste
Your food purchasing habits have more flexibility than most operators assume. Suppliers negotiate regularly, especially with customers who pay on time and order consistently. Requesting quarterly pricing reviews and comparing quotes from two or three vendors gives you real leverage. Even a 2% reduction in your food cost percentage translates to thousands of dollars annually depending on your volume.
Waste reduction works alongside purchasing to tighten food cost without affecting your menu. Tracking which menu items generate the most leftover prep at the end of service tells you where over-ordering is happening. Adjusting par levels based on actual sales data rather than estimates cuts waste directly and brings your food cost percentage closer to the 28-32% benchmark without changing a single recipe.
Shift online orders away from third-party platforms
Third-party delivery commissions are one of the most actionable cost reductions available to restaurant owners right now. Paying 15-30% per order to platforms like DoorDash or Uber Eats means you're working harder on high-volume delivery days while keeping less of every dollar you earn. Moving those orders to your own commission-free ordering system eliminates that variable cost entirely.
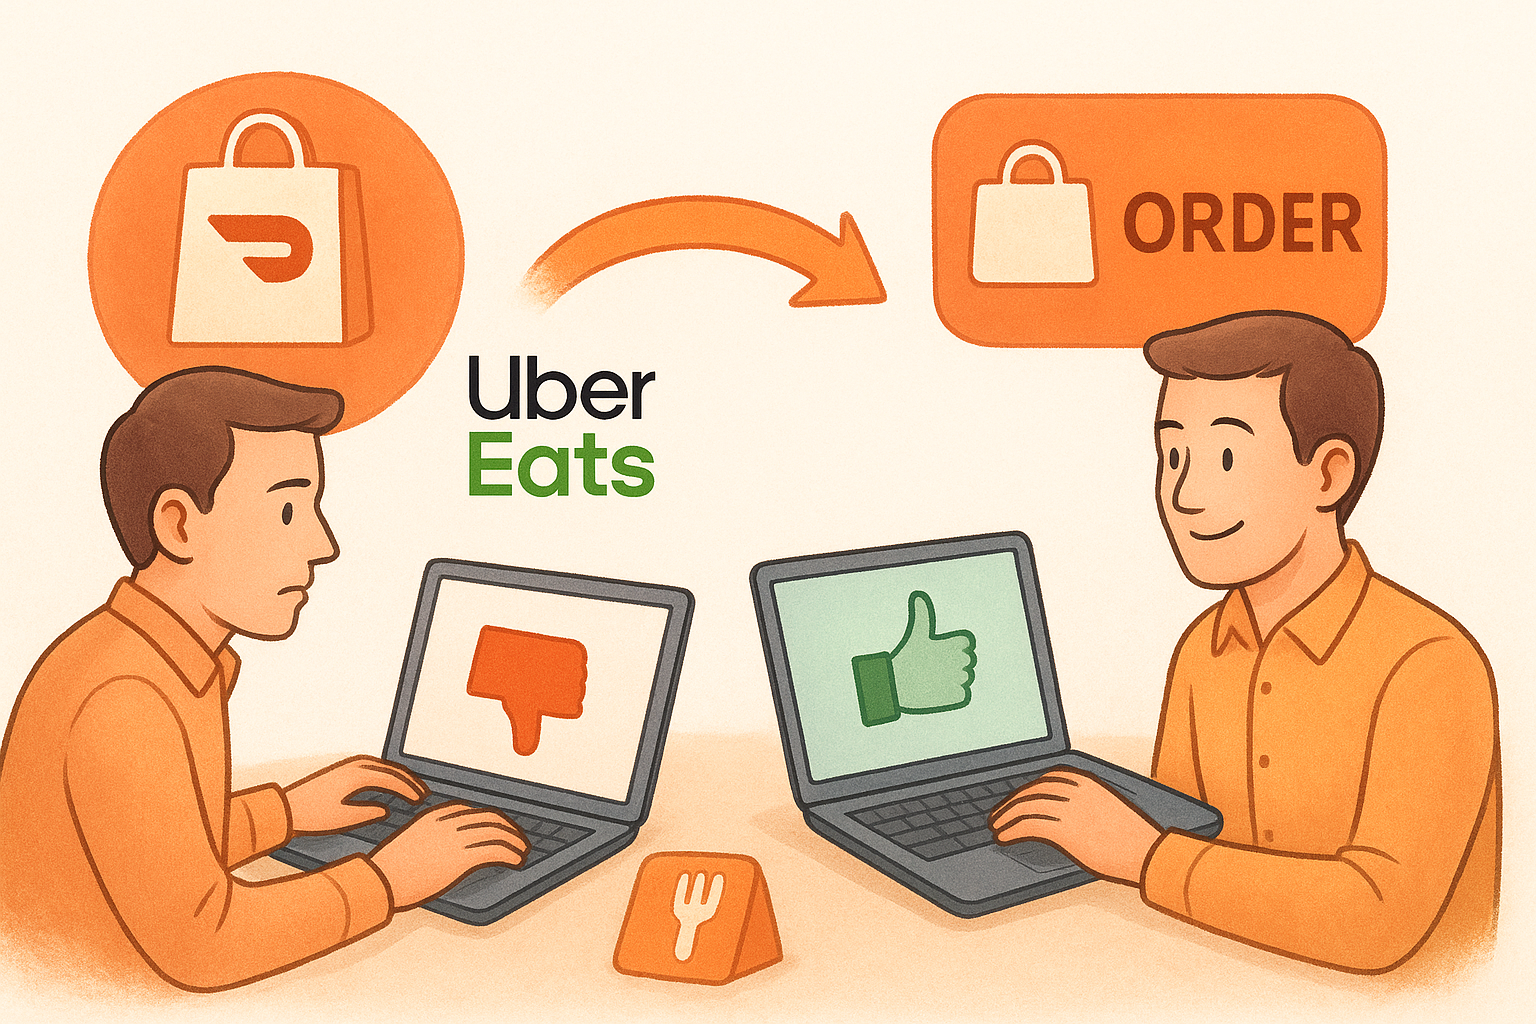
Switching even 40% of your delivery volume to direct ordering can recover several percentage points of margin without changing anything else in your operation.
The Foody Gram gives restaurants a branded online ordering system that processes orders directly, deposits revenue straight to your account, and charges a flat monthly fee instead of a per-order commission. That shift alone restructures one of your largest variable costs from a percentage of revenue to a predictable fixed expense.
Align labor scheduling with actual sales patterns
Labor cost overruns almost always come from scheduling based on habit rather than data. Most point-of-sale systems give you hour-by-hour sales reports that show exactly when your volume peaks and when it drops. Using that data to build schedules each week means you're staffing for what the numbers predict, not what last month felt like.
Cross-training staff across multiple roles gives you scheduling flexibility during slower periods without leaving gaps in coverage. When one person can handle multiple stations, you avoid carrying extra headcount just to fill a single specialized position.
Common questions about restaurant expenses
When restaurant owners start working through a full restaurant operating costs breakdown, the same questions come up repeatedly. The answers below address the most common ones so you can move forward with a clearer picture of what to expect and where to focus.
What is a good operating cost percentage for a restaurant?
A healthy total operating cost percentage typically falls between 75% and 85% of revenue, which leaves a 15-25% gross margin before taxes and debt service. Most independent restaurants land closer to the 85% mark in practice, with net profit margins settling between 3% and 9% after all obligations are paid. The closer you can keep your combined costs to the lower end of that range, the more cushion you carry for unexpected expenses or slower months.
Restaurants that consistently track their costs by category tend to outperform those that only review totals, because they can identify which specific line item is pulling the average up.
What is the biggest expense for most restaurants?
Labor cost is the largest single expense category for the majority of full-service restaurants, often landing between 25% and 35% of revenue. Food cost runs a close second, typically sitting in the 28-35% range depending on your menu and concept type. Together, these two categories form your prime cost, and keeping that combined figure at or below 65% of revenue is the clearest indicator of whether your operation has a viable financial structure.
Some restaurants find that occupancy cost becomes the most damaging expense if they signed a lease in a high-rent market without enough volume to offset it. In those cases, the fixed nature of rent makes it harder to manage than food or labor, which both offer more room to adjust.
How often should you review your costs?
Weekly reviews of food cost and labor cost percentages give you the fastest feedback loop available. Both categories can shift meaningfully within a single week based on purchasing decisions, waste, or scheduling changes, and catching those shifts early prevents them from compounding into a monthly problem. Monthly reviews serve a different purpose: they give you a broader view of occupancy, utilities, and technology costs that don't move as frequently but still require regular attention.
Quarterly reviews work well for evaluating supplier pricing, renegotiating contracts, and assessing whether your menu prices still reflect your actual cost structure. Building all three review cadences into your routine gives you both the short-term visibility and the long-term perspective that running a profitable restaurant requires.
Key takeaways
A complete restaurant operating costs breakdown gives you the information you need to make decisions based on data rather than instinct. Your prime cost (food plus labor) should stay at or below 65% of revenue. Occupancy typically runs 5-10%, and every other expense category deserves its own benchmark and its own weekly review. When you track costs at the category level, problems become visible early enough to fix without damage.
One of the fastest ways to recover margin is cutting third-party delivery commissions out of your variable cost structure entirely. Shifting online orders to a direct, commission-free system turns a percentage-of-revenue drain into a flat, predictable monthly expense. That single change can recover several points of margin without touching your menu, your team, or your customer experience. If you're ready to see what that looks like in practice, explore The Foody Gram's commission-free ordering plans and run the numbers for your own restaurant.