

Profit-First Pricing: Restaurant Menu Pricing Template (2026)
Most restaurant owners set their menu prices based on gut feeling, competitor copying, or a quick food cost guess. The result? Thin margins that get even thinner once you factor in labor, waste, overhead, and those 30% commission fees from third-party delivery apps. A solid restaurant menu pricing template takes the guesswork out of the equation and replaces it with actual numbers you can build a business on.
The math behind profitable pricing isn't complicated, but it does require structure. You need to know your exact ingredient costs per dish, your target food cost percentage, and how each item contributes to your bottom line. Without a system to track all of this, you're essentially flying blind every time you print a new menu.
That's why we put this guide together. Below, you'll find a step-by-step breakdown of how to use a menu pricing template to calculate costs, set prices, and protect your margins, whether you're opening your first location or repricing an existing menu. We've also included downloadable templates you can start using right away. And because pricing only matters if you actually keep what you earn, we'll show you how pairing smart pricing with a commission-free ordering system like The Foody Gram means more of every dollar stays in your pocket instead of going to a middleman.
What a menu pricing template should include
A good restaurant menu pricing template does more than list item prices. It connects every cost that touches a dish, from raw ingredients to portion size to waste, and converts that data into a price point that keeps you profitable. Most free templates stop at basic food cost, which leaves out critical variables and leads to prices that look right but actually bleed money over time.
The sections below break down every component your template needs. Each one feeds the next, so skipping any of them creates a gap where margin leaks quietly without you noticing until the end of the month.
The ingredient cost table
Your template's foundation is a master ingredient list that ties every product you buy to its cost per unit of measure. That means recording the price you paid, the pack size, and the cost per ounce, gram, cup, or piece, depending on how your recipes are written.
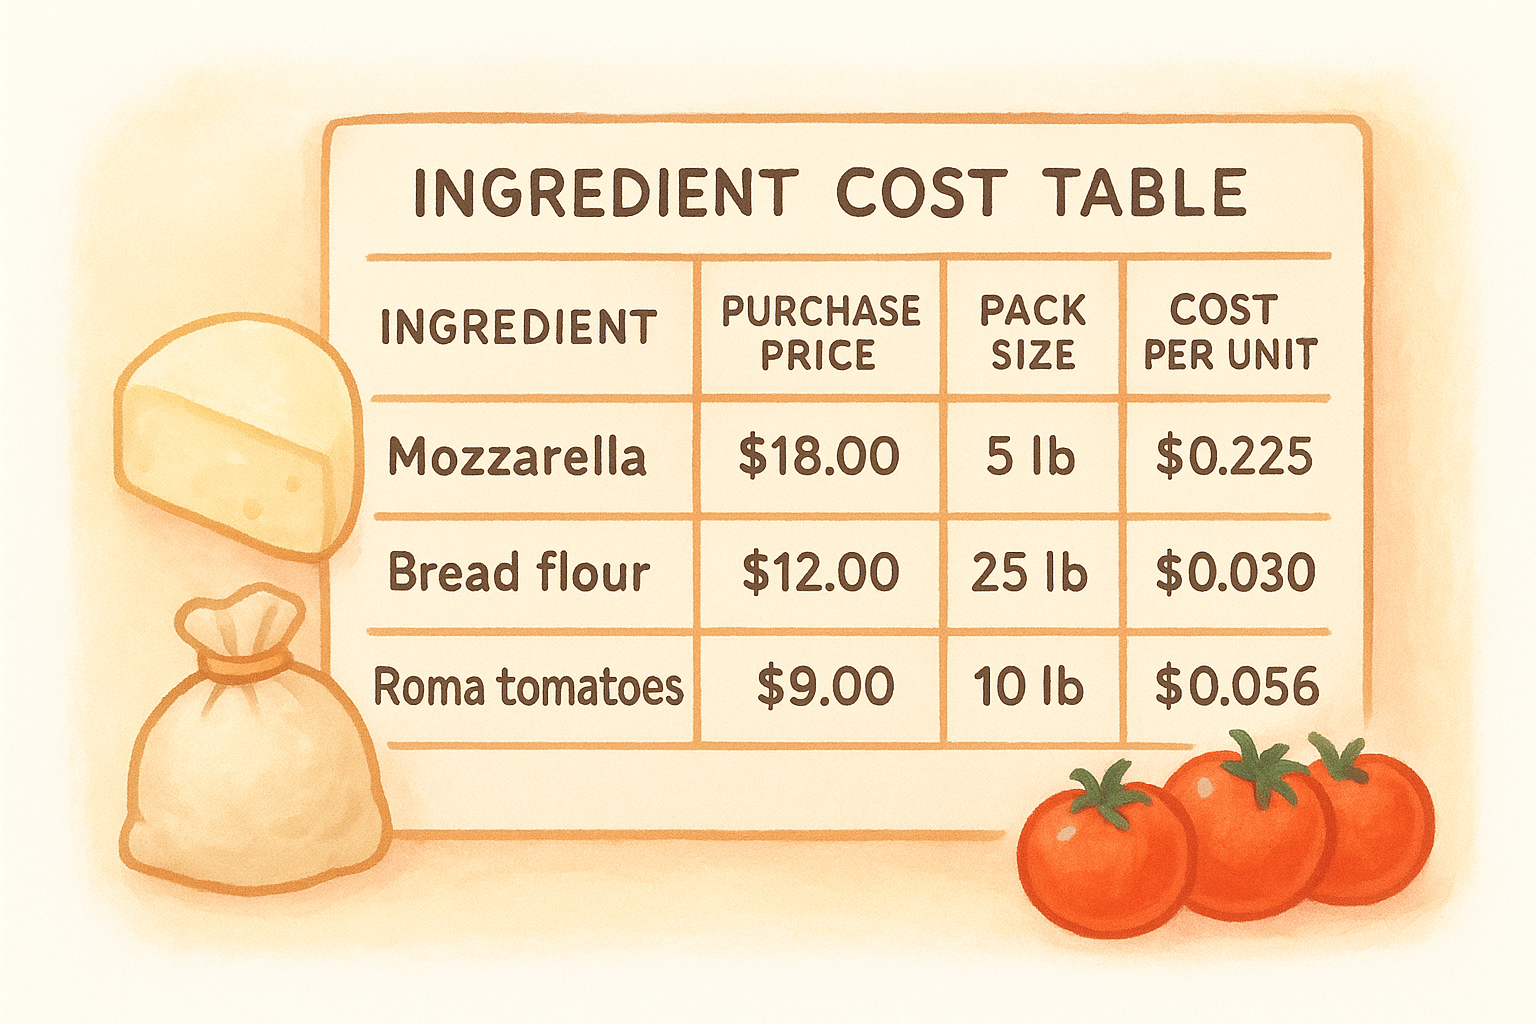
| Ingredient | Purchase price | Pack size | Unit | Cost per unit |
|---|---|---|---|---|
| Mozzarella | $18.00 | 5 lb bag | oz | $0.225 |
| Bread flour | $12.00 | 25 lb bag | oz | $0.030 |
| Roma tomatoes | $9.00 | 10 lb case | oz | $0.056 |
Keep this table separate from your recipe rows. When a supplier price changes, update it here once, and every recipe that references that ingredient recalculates automatically. In Excel or Google Sheets, this means using cell references rather than typing costs directly into each recipe.
Recipe costing rows
For each menu item, your template should list every ingredient alongside the exact quantity used per portion. Multiply each ingredient's quantity by its cost per unit from your ingredient table, then sum the total. That gives you your raw food cost per dish.
You also need a yield factor column for any ingredient that loses weight during prep or cooking. A chicken breast that costs $0.40 per raw ounce but loses 25% during cooking actually costs $0.53 per cooked ounce. Skipping this step understates your true cost on almost every protein and produce item you serve.
If you don't account for yield loss, your food cost will always look lower than it actually is, and you'll price yourself into a loss without any clear warning sign.
Food cost percentage and target markup
Once you know what a dish costs to produce, your template needs a column that calculates food cost percentage using this formula:
Food Cost % = (Ingredient Cost ÷ Menu Price) × 100
Most full-service restaurants target a food cost between 28% and 35%. Quick-service and fast-casual concepts typically run tighter, around 22-28%. Your template should let you input your target percentage and return the minimum price you need to charge to hit it, so pricing becomes a calculation instead of a guess.
Contribution margin tracking
Food cost percentage shows you the ratio, but contribution margin tells you the actual dollar amount each dish adds toward covering labor, rent, and overhead after ingredient cost. A dish with a $4 food cost priced at $14 contributes $10. A dish with a $7 food cost priced at $16 contributes only $9.
Your template should track both figures side by side. High contribution margin items in dollar terms are often your most valuable dishes to push and promote, even if their food cost percentage looks slightly higher than your target. Watching only the percentage column causes many restaurant owners to underprice their best performers and over-rely on low-margin volume items that never move the needle on actual profit.
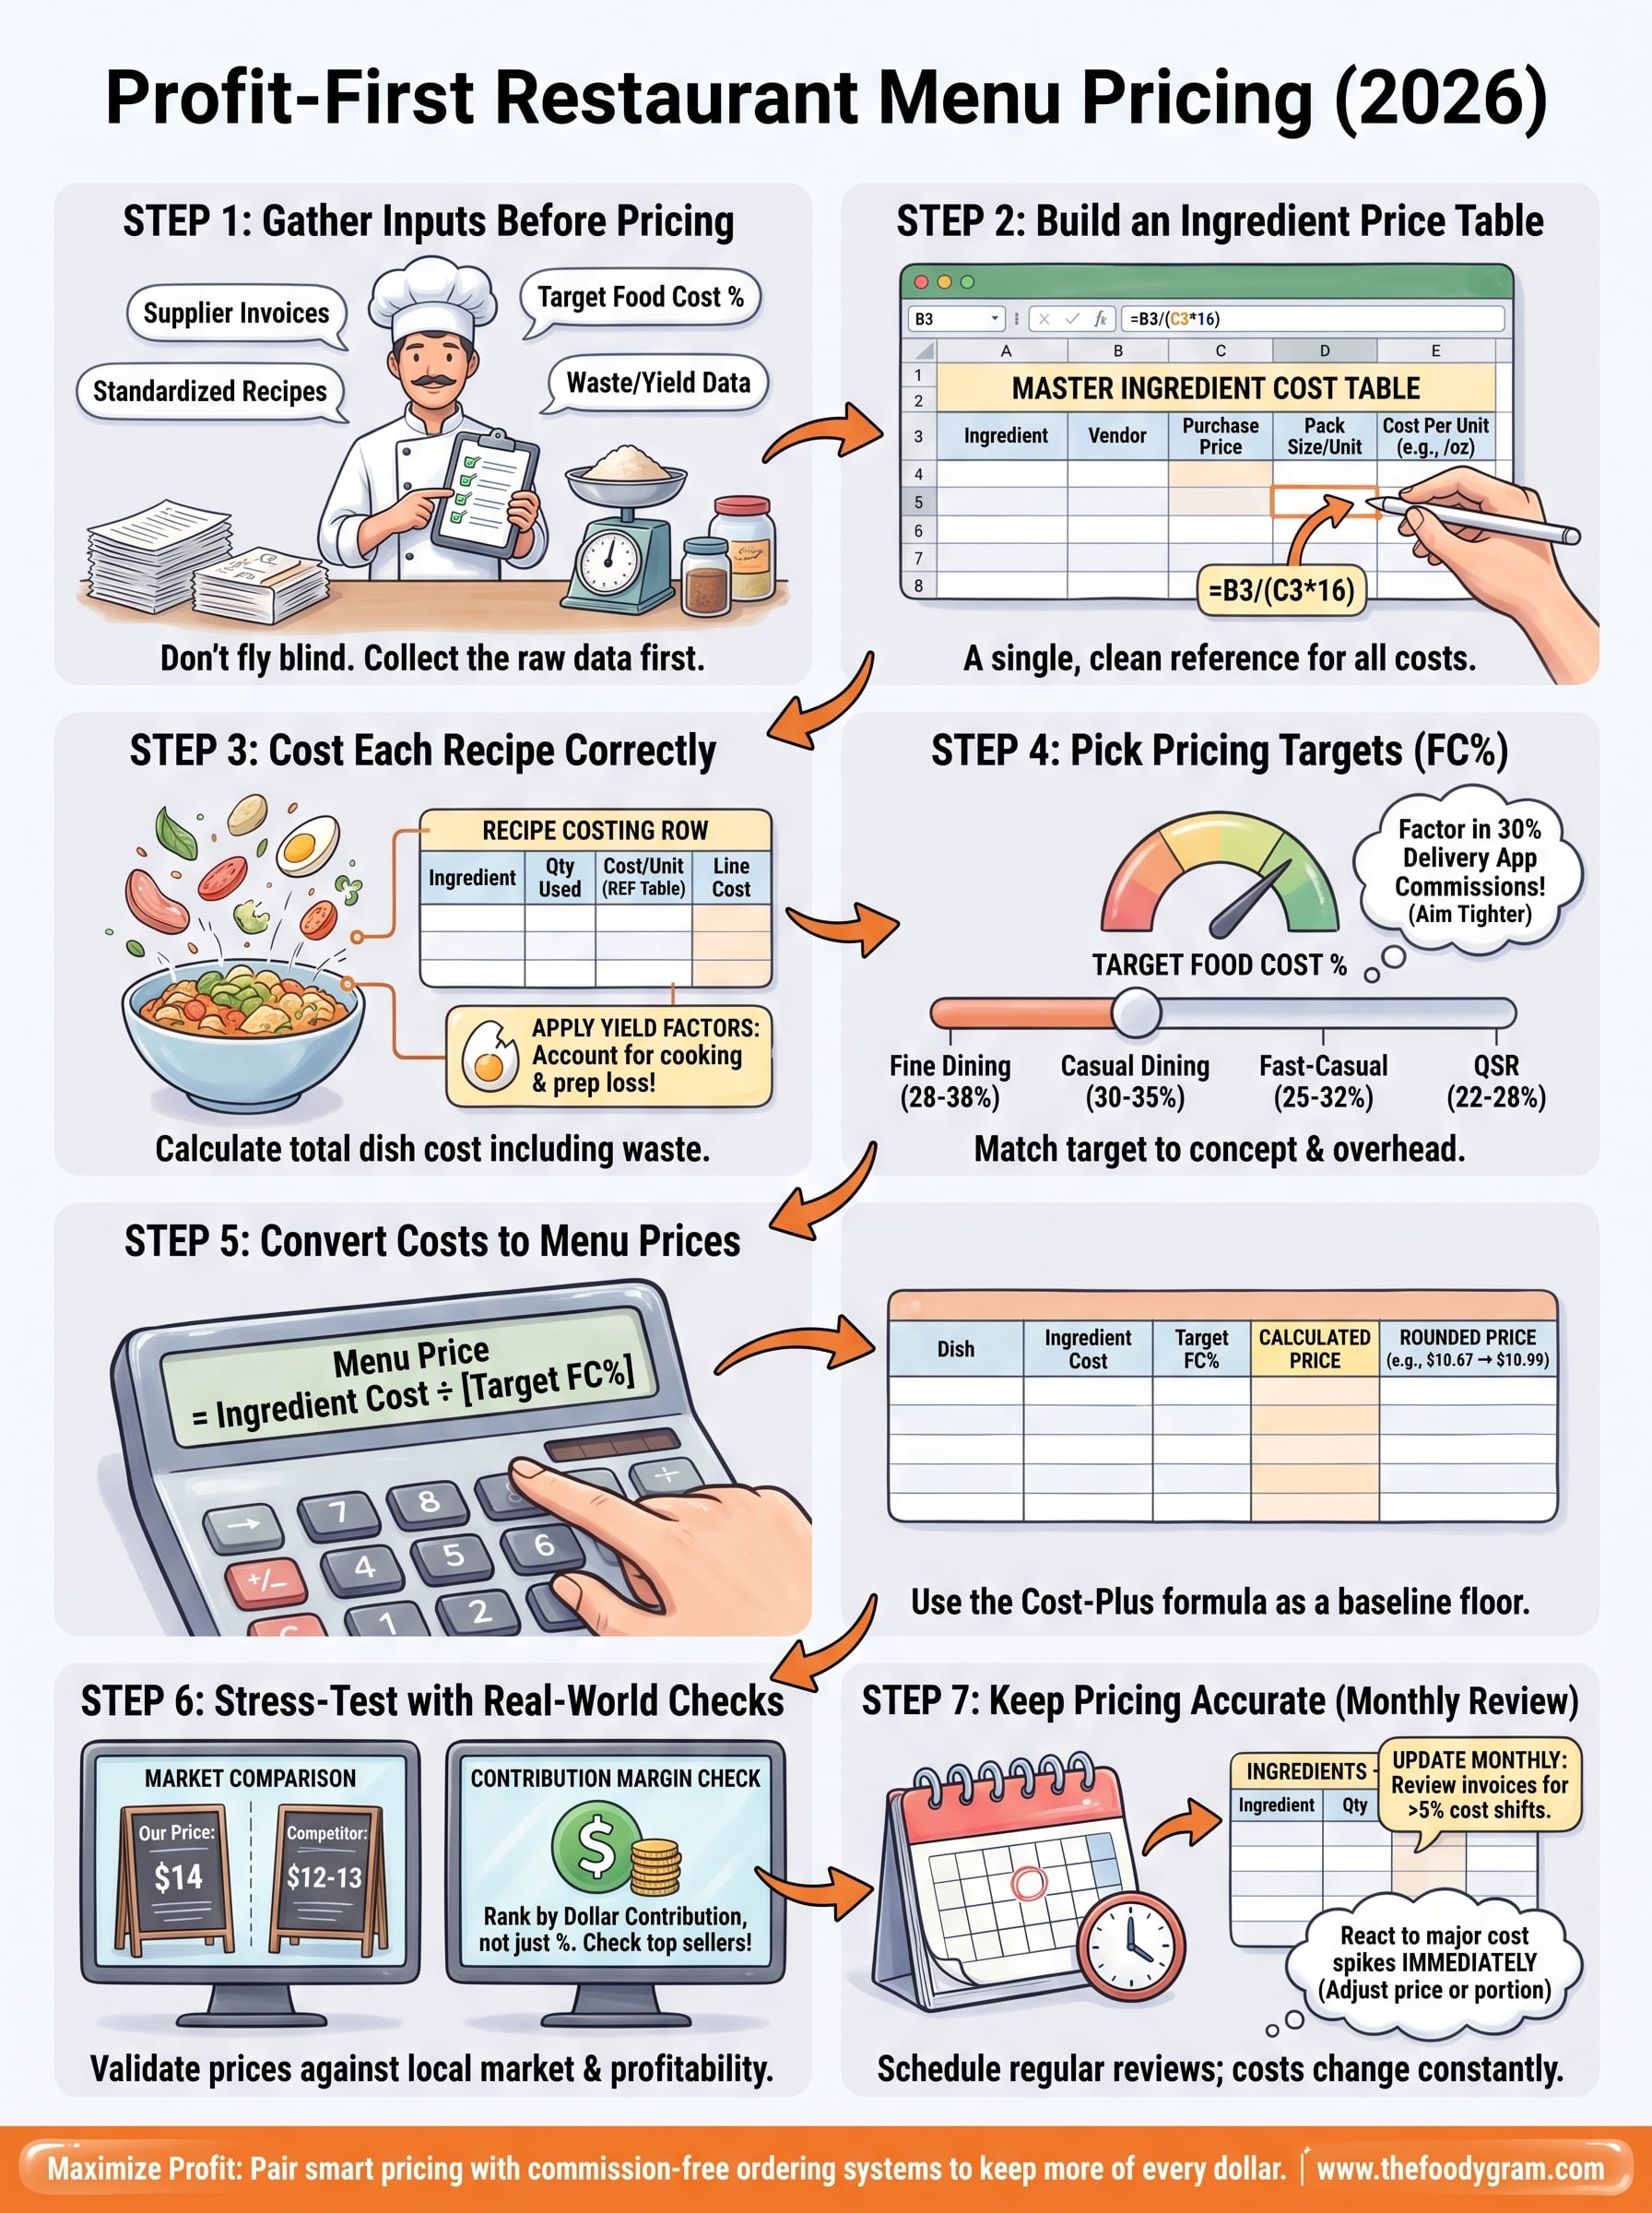
Step 1. Gather your inputs before you price anything
Before you enter a single number into your restaurant menu pricing template, you need to collect the raw data that makes the whole system work. Jumping straight into the spreadsheet without this prep is the most common reason restaurant owners end up with inaccurate costs and unreliable prices. Spend 30 to 60 minutes pulling these inputs together first, and every step after this one gets faster and more accurate.
What you need before opening the spreadsheet
You need four categories of information ready before you start building or filling in any template. Missing even one category forces you to estimate, and estimates compound into significant pricing errors by the time you reach your final menu price.
Here's what to gather:
- Supplier invoices from the last 30 days for every ingredient you actively use. Prices fluctuate, so recent invoices give you current costs rather than outdated numbers.
- Pack sizes and units for each product (pounds, ounces, liters, count). You need this to calculate cost per usable unit accurately.
- Standardized recipes for every menu item, including exact quantities per portion. If your recipes live in a chef's head or vary by shift, write them down and lock them in before pricing them.
- Your target food cost percentage based on your concept type. Full-service restaurants typically aim for 28-35%, while fast-casual and counter-service concepts often target 22-28%.
- Waste and yield data for proteins, produce, and any ingredient that loses volume during trimming or cooking. Even rough yield percentages are better than ignoring the loss entirely.
If your recipes aren't standardized before you start costing, every price you calculate will be based on an average of possible outcomes rather than a fixed, repeatable dish.
Where to find your current costs
Your supplier invoices are the most reliable source for current ingredient prices. Pull the three most recent deliveries for any ingredient where prices fluctuate regularly, like proteins and produce, and use the average. For dry goods and shelf-stable items, a single recent invoice is usually sufficient.
If you use a POS system that tracks ingredient purchases, export that data directly into your template. Systems like Toast or Square for Restaurants often include basic cost reporting you can reference. For everything else, a simple folder of scanned invoices sorted by vendor works fine. The goal isn't a perfect system yet; it's having accurate, verifiable numbers to start from.
Step 2. Build an ingredient price table that stays clean
Your ingredient price table is the engine behind every cost calculation in your restaurant menu pricing template. If this table has errors or missing units, every recipe cost you build on top of it will be wrong. The goal here is a single, reliable reference sheet that all your recipe rows point back to, so you only need to update one place when a price changes.
Structure your table with the right columns
Your table needs five columns to function correctly. Each one plays a specific role, and skipping any of them forces you to recalculate costs manually every time something changes. Set it up once with the structure below, and it will save you hours of work over the life of your menu.
| Ingredient | Vendor | Purchase price | Pack size + unit | Cost per unit |
|---|---|---|---|---|
| Chicken breast (raw) | US Foods | $42.00 | 40 lb case | $0.066/oz |
| Cheddar cheese | Sysco | $22.00 | 5 lb block | $0.275/oz |
| Russet potatoes | Local produce | $14.00 | 50 lb bag | $0.018/oz |
| Olive oil | Restaurant Depot | $28.00 | 1 gal jug | $0.219/oz |
| Panko breadcrumbs | Sysco | $9.00 | 10 lb bag | $0.056/oz |
The cost per unit column is the number your recipe rows will reference. In Google Sheets or Excel, use a formula like =B3/(C3*16) to convert a price-per-pound purchase into a cost-per-ounce figure automatically. That way, if your vendor charges $44.00 next month instead of $42.00, you update one cell and the entire template recalculates.
Never type a cost directly into a recipe row. Always reference back to the ingredient table so updates flow through the whole spreadsheet automatically.
Keep the table accurate over time
Plan to review your ingredient table once a month, or immediately after any major delivery shows a price change. Proteins and produce shift the most often, while dry goods tend to stay stable for longer stretches. Pull your most recent invoices, compare them to the current table, and update any rows that have moved by more than 5%.
Adding a "last updated" column next to each ingredient gives you a quick visual check on which rows are stale. If a row hasn't been touched in 60 days and it's a produce or protein item, treat that number as unreliable until you verify it against a current invoice.
Step 3. Cost each recipe the right way
With your ingredient table built, you're ready to cost individual recipes. This is where your restaurant menu pricing template does its most important work: translating raw ingredient costs into a total dish cost you can actually price from. Each recipe row should pull directly from your ingredient table rather than use manually typed numbers, so the two sheets stay connected and update together automatically.
Build a recipe costing row for each dish
For every menu item, create a dedicated section in your spreadsheet with one row per ingredient. Each row needs the ingredient name, the quantity used per portion, a reference to that ingredient's cost per unit from your master table, and a calculated cost for that specific quantity. Sum all the rows at the bottom to get your total food cost per dish.
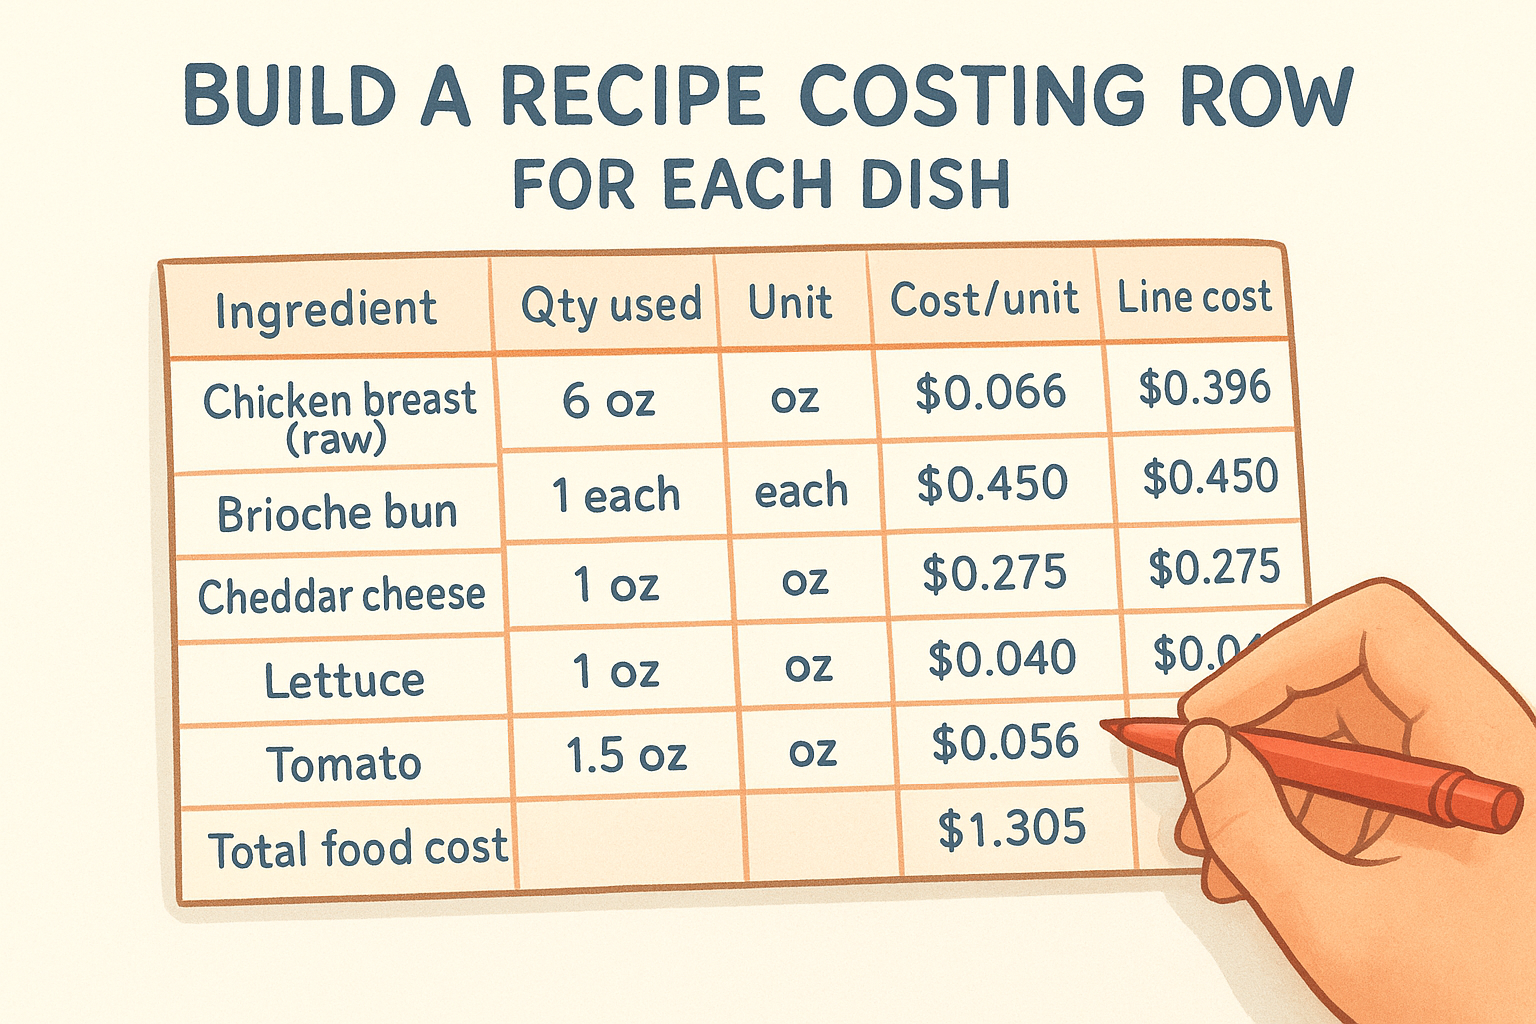
Here's what a completed recipe costing block looks like for a basic grilled chicken sandwich:
| Ingredient | Qty used | Unit | Cost/unit | Line cost |
|---|---|---|---|---|
| Chicken breast (raw) | 6 oz | oz | $0.066 | $0.396 |
| Brioche bun | 1 each | each | $0.450 | $0.450 |
| Cheddar cheese | 1 oz | oz | $0.275 | $0.275 |
| Lettuce | 1 oz | oz | $0.040 | $0.040 |
| Tomato | 1.5 oz | oz | $0.056 | $0.084 |
| Garlic aioli | 0.5 oz | oz | $0.120 | $0.060 |
| Total food cost | $1.305 |
Every cell in the "Cost/unit" column should reference your ingredient table directly using a formula like =IngredientTable!E4 rather than a number you typed in manually. This keeps the two sheets synchronized so a single price update flows through every recipe that uses that ingredient.
Apply yield factors to proteins and produce
Raw ingredient cost is not the same as usable ingredient cost once you account for trimming, cooking loss, and prep waste. A chicken breast that weighs 8 oz raw but delivers 6 oz of cooked, plated protein means your actual cost per usable ounce is higher than the purchase price alone suggests.
Skipping yield adjustments is one of the most common reasons food costs come in 3-5% higher than projected at the end of a month.
To apply a yield factor, divide the raw cost per unit by your yield percentage as a decimal. If chicken costs $0.066 per raw ounce and yields 75% after cooking, your usable cost per ounce becomes $0.088 (0.066 ÷ 0.75). Add a yield column to your recipe rows and build this calculation into each protein and produce line. For shelf-stable dry goods with no meaningful prep loss, a yield factor of 100% keeps the math consistent without adding unnecessary steps to straightforward ingredients.
Step 4. Pick pricing targets that fit your concept
Your food cost percentage target sets the ceiling for every price your restaurant menu pricing template outputs. Choose a target that's too aggressive and you'll price yourself out of the market. Choose one that's too loose and you'll generate revenue without actually building profit. The right number depends on your concept type, service model, and overhead structure, not on what another restaurant down the street charges.
Match your food cost target to your service model
Different restaurant formats carry different cost structures, which means the same food cost percentage that keeps a fine dining restaurant profitable would sink a fast-casual concept. Lower overhead formats need tighter food cost targets because they have less labor, rent, and service cost to spread across each ticket. Higher overhead formats can afford a wider food cost because higher average check sizes contribute more gross dollars per cover even at the same percentage.
Use this table as your starting point when setting targets in your template:
| Concept type | Target food cost % | Notes |
|---|---|---|
| Fine dining | 28-38% | Higher labor and overhead justify a wider range |
| Casual dining | 30-35% | Mid-range target; watch portion sizes closely |
| Fast-casual | 25-32% | Moderate labor cost; efficiency drives margin |
| Counter service / QSR | 22-28% | Low labor, high volume; tight cost control required |
| Pizza / delivery-focused | 25-32% | Factor in packaging cost as part of food cost |
| Bars with food | 20-30% | Food cost often offset by high-margin beverage sales |
These ranges give you a starting point, but your actual target should reflect your specific overhead, labor model, and average check, not just your concept category.
Factor in the costs food cost percentage ignores
Food cost percentage only measures what you spend on ingredients against what you charge for a dish. It does not account for labor, packaging, credit card processing fees, or the commissions you pay to third-party delivery apps. If a delivery platform takes 30% of every order, a dish priced to hit a 30% food cost target is actually generating a loss once the commission clears.
Build those additional cost layers into your thinking before you finalize any target. A practical way to do this is to set your food cost target 3-5 percentage points tighter than your baseline on any items you sell through high-commission channels, so you preserve actual margin after platform fees. If you switch to a commission-free ordering system, that buffer goes back into your pocket instead of disappearing at checkout.
Step 5. Turn costs into menu prices with a repeatable method
Once you know your total recipe cost and your target food cost percentage, turning that data into an actual menu price takes a single, consistent formula. Your restaurant menu pricing template should calculate this price automatically so you never rely on rounding up to a round number or copying a competitor's pricing structure.
Use the cost-plus formula as your baseline
The standard formula for converting food cost into a menu price is straightforward:
Menu Price = Ingredient Cost ÷ [Target Food Cost](https://www.thefoodygram.com/blogs/news/how-to-price-food-menu-items) %
If a dish costs $3.20 to produce and your target food cost is 30%, your formula returns a minimum menu price of $10.67. Round that up to $10.99 or $11.00 depending on your pricing style, and you're working from math rather than instinct. Build this formula directly into your spreadsheet so that every recipe row produces a calculated price automatically when you enter a food cost target at the top of the sheet.
This formula gives you a floor, not a ceiling. If your market supports a higher price, charge it. More margin is always better than hitting a round percentage.
Here's how that looks across three dishes at different cost levels:
| Dish | Ingredient cost | Target FC% | Calculated price | Rounded price |
|---|---|---|---|---|
| Grilled chicken sandwich | $3.20 | 30% | $10.67 | $10.99 |
| Margherita pizza (12") | $4.85 | 28% | $17.32 | $17.50 |
| Caesar salad | $1.90 | 25% | $7.60 | $7.75 |
Adjust prices using contribution margin, not just percentage
Your calculated price is the starting point, but contribution margin in actual dollars should influence how you finalize each number. A dish with a $1.90 ingredient cost priced at $7.75 contributes $5.85. A dish with a $4.85 ingredient cost priced at $17.50 contributes $12.65. Even though both dishes hit your target food cost percentage, the pizza generates more than twice the gross dollars toward your overhead with each sale.
Use your template to rank every item by dollar contribution after you set prices. Push the high-margin dishes to prominent positions on your menu and use pricing anchors, where a higher-priced item makes the mid-range items look like better value, to steer customers naturally toward your most profitable options. This is a standard menu engineering move that costs nothing to implement once your spreadsheet already shows contribution margin next to each calculated price.
Step 6. Stress-test prices with real-world checks
The formula gives you a mathematically sound price, but math alone doesn't tell you whether a customer will pay $17.50 for a pizza or walk to the place next door. Before you lock in prices on your restaurant menu pricing template, run them through a set of real-world checks that validate your numbers against what the market will actually support.
Compare against your local market
Go online and look at three to five direct competitors in your area. Check their menus on their websites or through delivery app listings and note what they charge for items comparable to yours in portion size and quality level. You're not trying to match their prices exactly, but you need to know where your calculated prices land relative to local customer expectations. If your chicken sandwich formula returns $13.99 and every similar restaurant nearby charges $11-12, you have a gap that requires a decision: reduce portion size, find a cheaper supplier, accept a thinner margin, or differentiate the dish clearly enough to justify the premium.
If your price requires a significant quality story to justify it, make sure that story is visible on your menu through descriptions, sourcing callouts, or portion size cues.
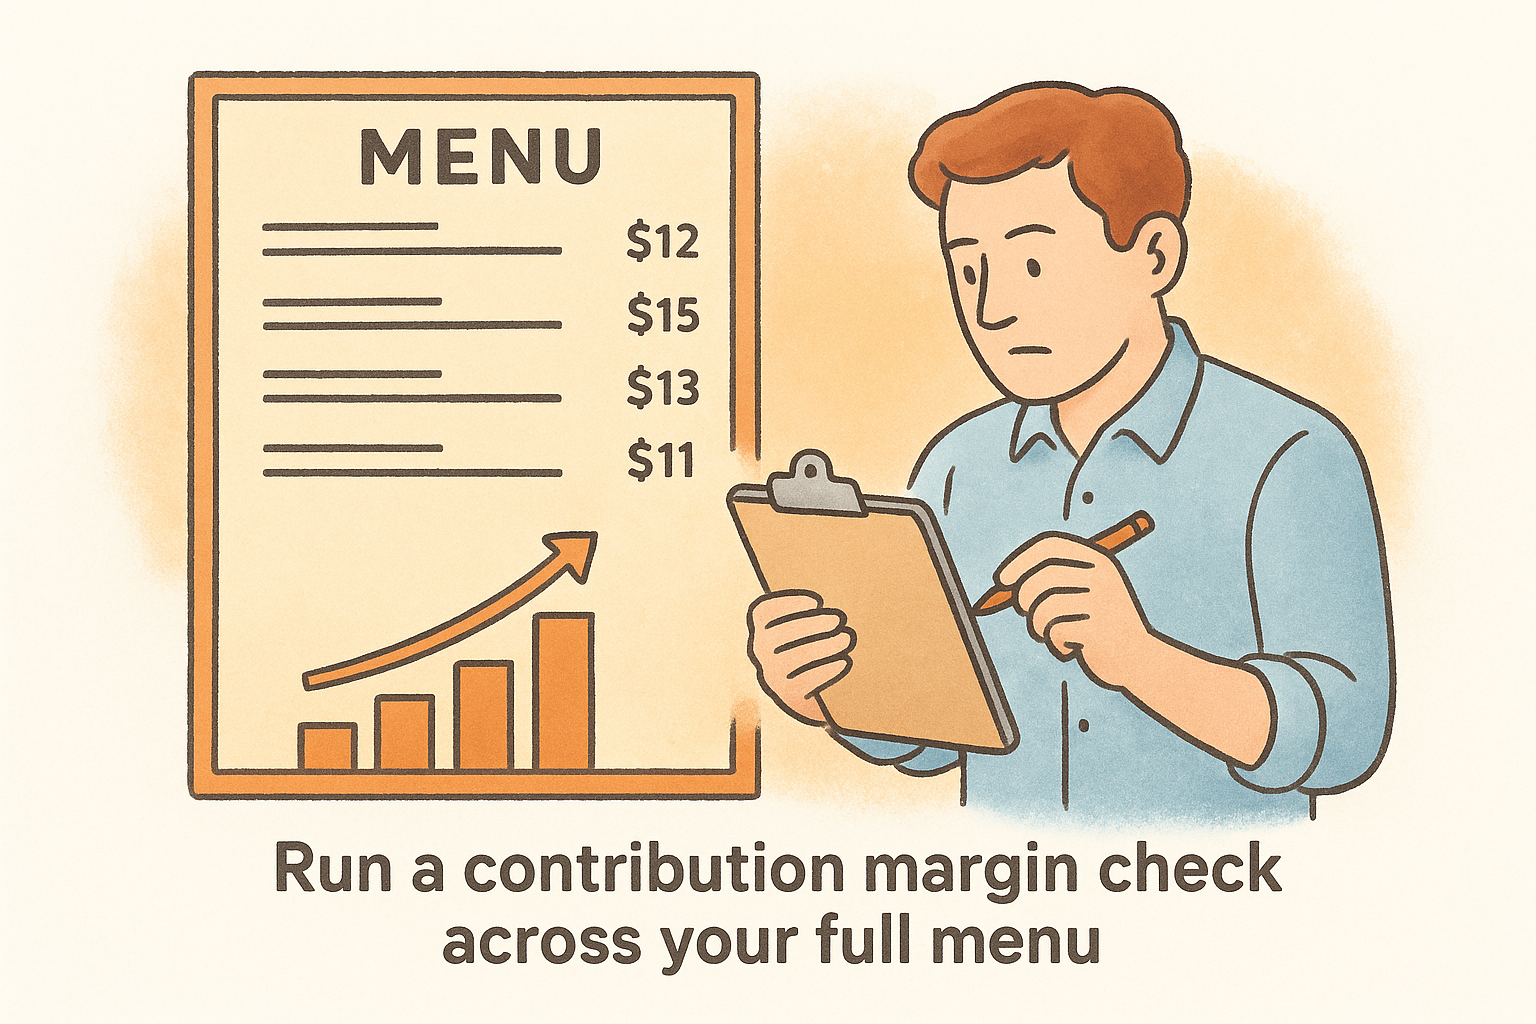
Run a contribution margin check across your full menu
Pull every item into a single view and sort by dollar contribution margin from highest to lowest. Look for two specific problems: items where the contribution margin sits under $4-5, which often means they're volume fillers that don't actually move your bottom line, and items where the food cost percentage looks fine but the dollar margin is weak because the sell price is too low to matter.
Check your top five sellers specifically. If any of them sit in the bottom half of your contribution margin ranking, you're selling high volume at low return. A $0.50 price increase on a dish that sells 80 times a day adds $40 daily and roughly $1,200 per month in pure margin without a single new customer. Small price adjustments on high-velocity items have a disproportionate impact on profit, and most customers won't notice a 50-cent change on a dish they already order regularly.
Run every item through this checklist before locking in your final prices:
- Does the price sit within 15% of comparable local competitors?
- Does the dish generate at least $5 in contribution margin after ingredient cost?
- Is the food cost percentage within your target range for your concept type?
- If sold through a delivery platform, does the margin survive a 25-30% commission cut?
Step 7. Keep pricing accurate as costs and sales change
Your restaurant menu pricing template is not a set-it-and-forget-it document. Ingredient costs shift with seasons, supplier contracts, and supply chain disruptions, and the prices you locked in six months ago can quietly erode your margins without triggering any obvious warning. Building a scheduled review process into your workflow keeps your template current and ensures your prices stay grounded in what you actually pay, not what you paid when you first built the spreadsheet.
Set a monthly review routine
Once a month, pull your most recent supplier invoices and compare them against the costs currently sitting in your ingredient price table. Flag any item that has moved by more than 5% in either direction and update the table before doing anything else. Because your recipe rows reference the ingredient table directly, those updates flow through every affected dish automatically, and your new food cost figures appear without any manual recalculation.
Use this monthly checklist to stay consistent:
- Update every protein and produce row with current invoice pricing
- Check packaging costs if you offer delivery or takeout and include them in your cost calculation
- Recalculate food cost percentages for your top 10 sellers
- Identify any item where food cost has risen above your target range by more than 2 percentage points
- Flag dishes that need a price adjustment and queue them for your next menu update
A monthly review takes less than an hour once your template is structured correctly, and it prevents the slow margin bleed that catches most restaurant owners off guard at the end of a quarter.
React to cost spikes immediately
Some price changes are too large to wait for your monthly review. A sudden 20-30% jump on chicken, beef, or cooking oil affects your food cost across multiple dishes at once, and delaying a response locks in losses on every order you fill in the meantime. When a major cost spike hits, update your ingredient table the same week you receive the new invoice and recheck the prices on every dish that uses that ingredient.
You have three responses available when costs spike: raise the menu price, reduce the portion size slightly while keeping the price stable, or substitute a lower-cost ingredient without changing the dish's quality perception. Your template makes it easy to model all three scenarios before you commit to any one of them. Run each option through the food cost and contribution margin columns, compare the outputs, and choose the path that protects the most dollar margin per cover rather than just hitting a percentage target.
Next steps
You now have everything you need to build a restaurant menu pricing template that produces accurate, defensible prices for every item on your menu. Start by gathering your supplier invoices and standardized recipes, then build your ingredient table before you touch a single recipe row. Work through each step in order, and your first complete cost sheet will take a few hours, not days.
Pricing your menu correctly is only half the equation. Every time a third-party delivery app collects a 30% commission on an order, your carefully calculated margin disappears before it reaches your bank account. Switching to a commission-free ordering system means the prices you set actually translate into the profit you planned for. The Foody Gram gives you a branded online ordering system with no per-order fees and no contracts. Check out our commission-free ordering plans and see how much more you keep per order.